Quality of hire definition, measurement frameworks, components, calculation methods.
[caption id="attachment_21055" align="alignnone" width="2752"]
Quality of Hire The Metric That Proves Your Recruiting Is Working[/caption]
Context and Overview
You hired 100 people this year. How many are top performers? How many are struggling? How many left?
Quality of hire is THE metric that determines if recruiting is working. Not speed-to-hire, not cost-per-hire. Those are means. Quality is the end.
Defining Quality of Hire
Quality of hire = performance of hired employee at 12 months
Measured by: Performance rating (top/average/below average), retention (still employed?), engagement (satisfied?), promotion (advanced?)
Example: 100 hired. At 12 months: 25 are top performers (still employed, high engagement, promoted/ready for promotion)
15 are average performers (still employed, moderate engagement)
10 are below-average (still employed, struggling)
50 have departed (couldn't retain)
Quality score: Only 25/100 = 25% top-performer hire rate
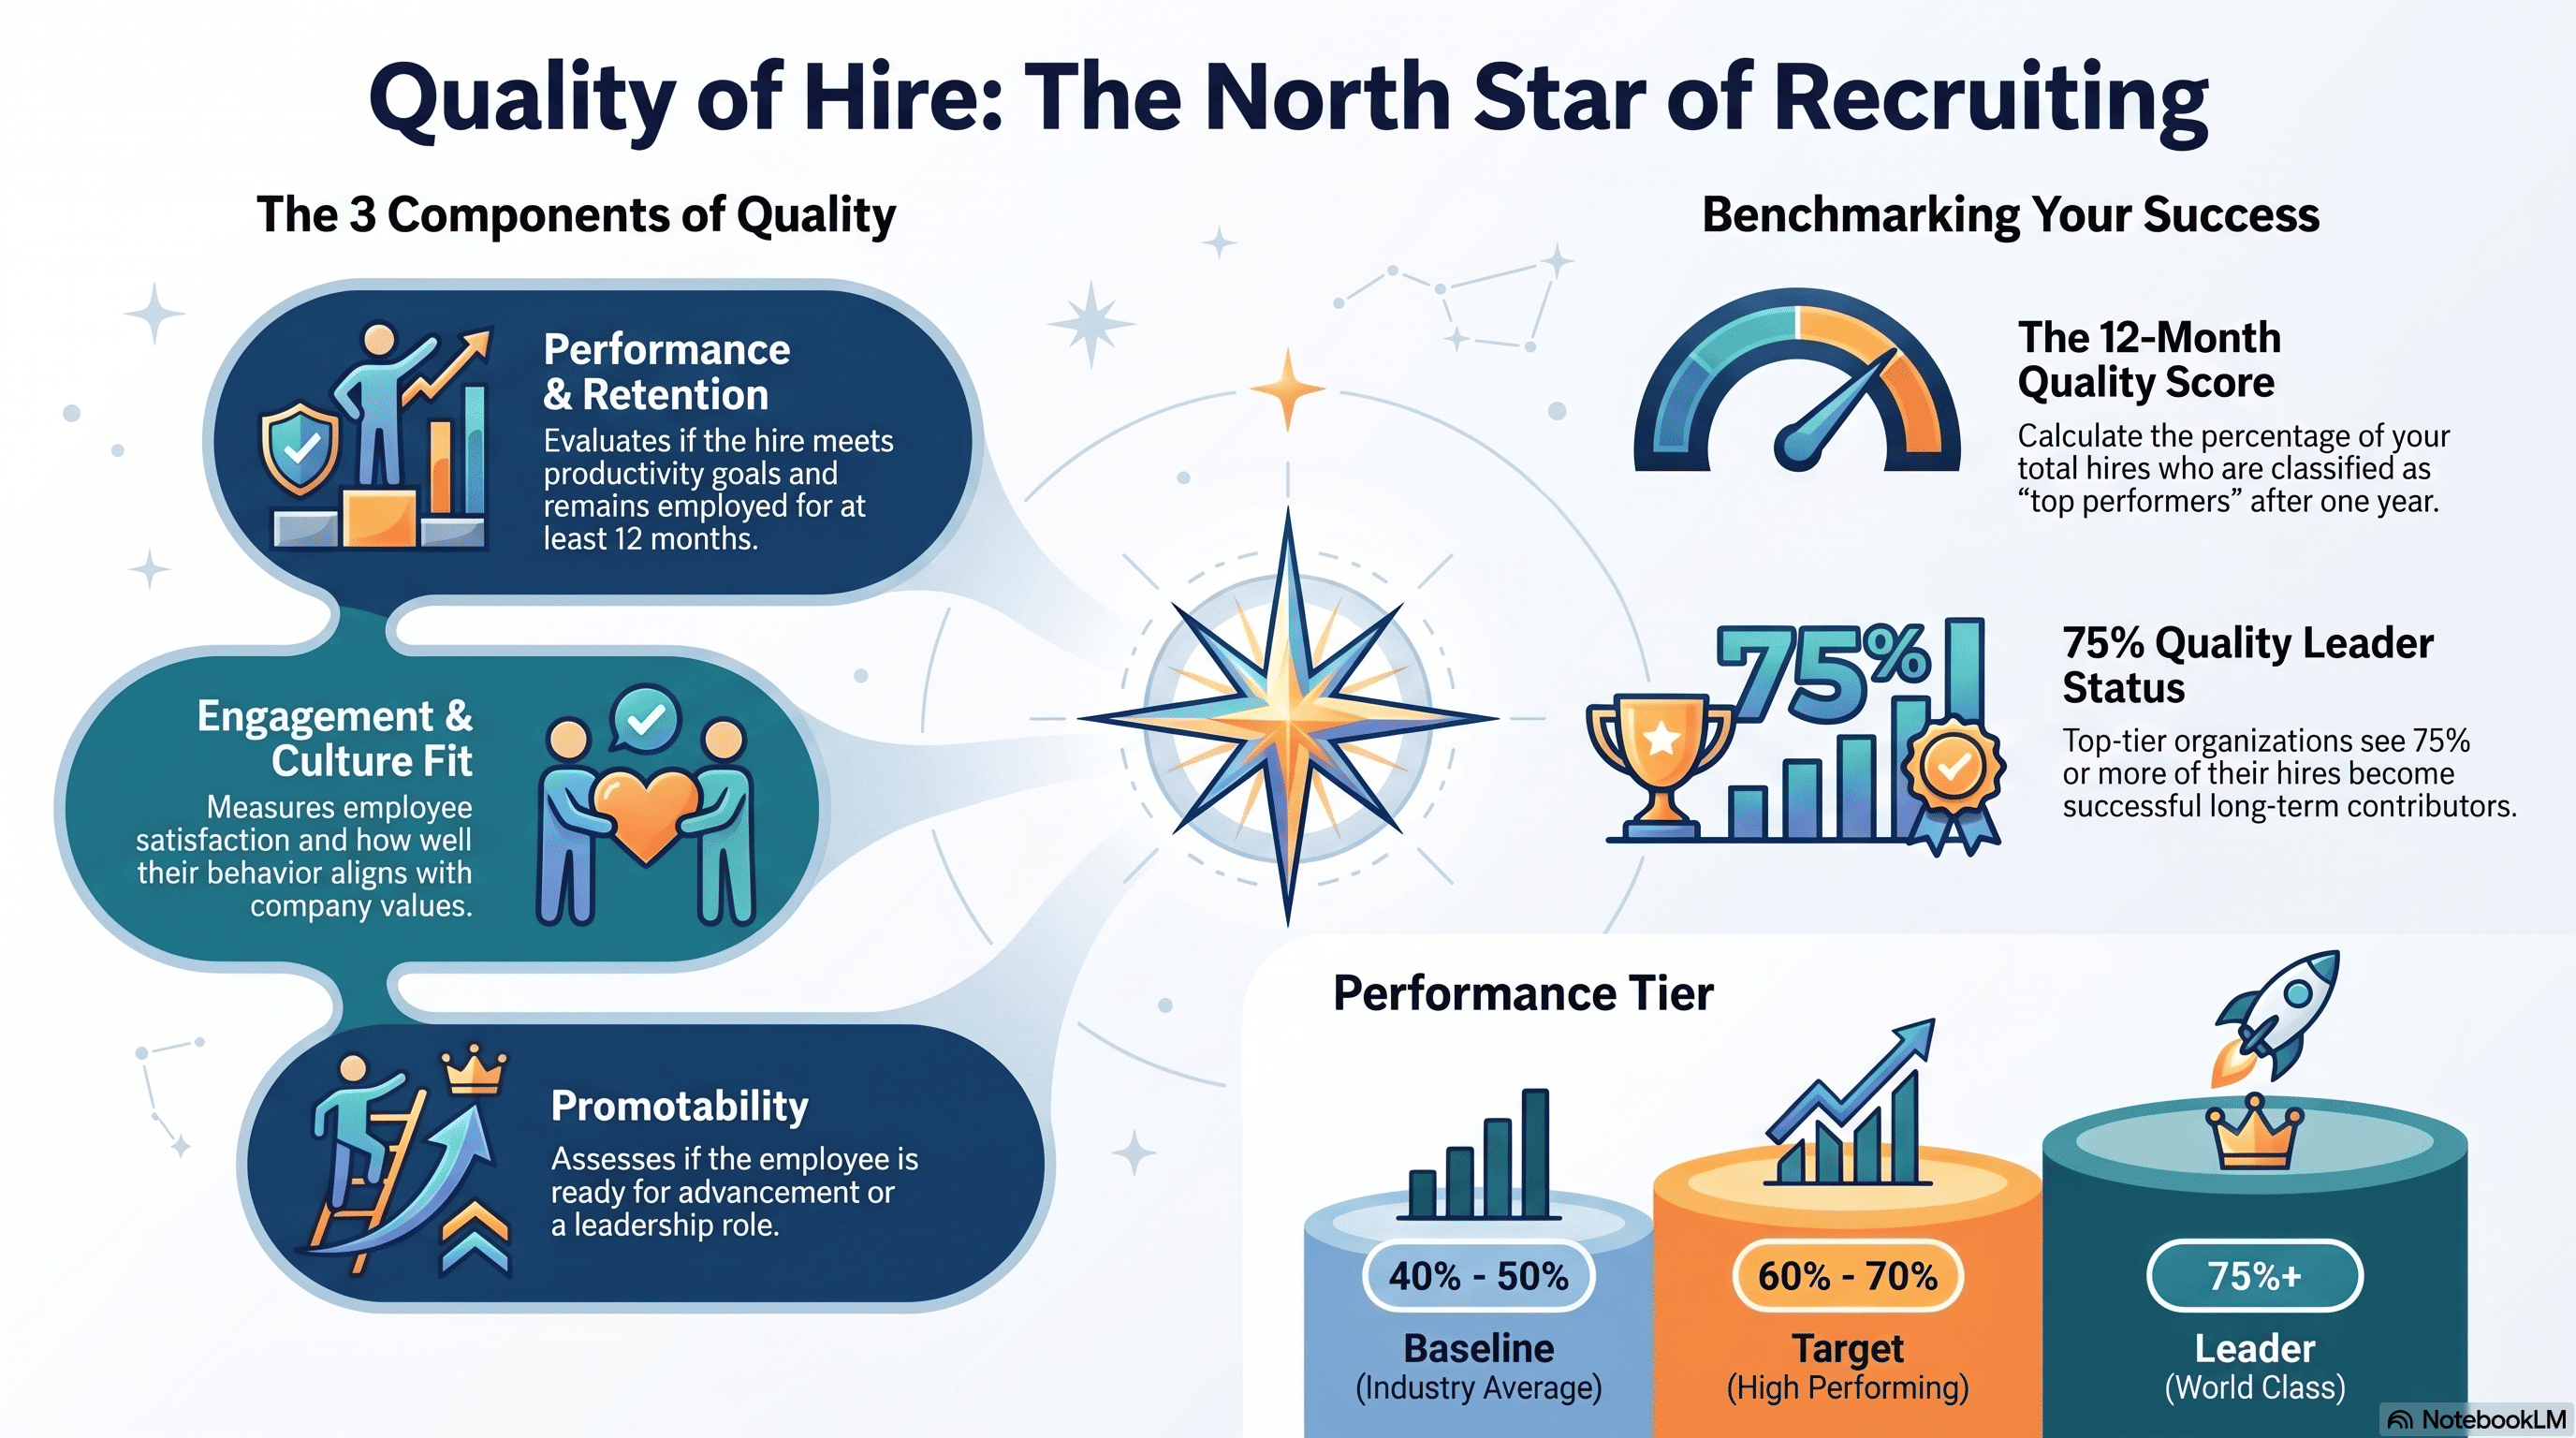
Components of Quality
Performance: Is hired employee performing at/above expected level? (Manager rating, productivity metrics, customer feedback)
Retention: Is employee still employed at 12 months? (Yes/No; attrition before 12 months = quality issue)
Engagement: Is employee engaged and satisfied? (Pulse survey, stay interview)
Promotability: Is employee ready for advancement? (Supervisor/lead role readiness)
Culture fit: Does employee align with company values and culture? (Manager assessment, peer feedback)
Calculation Method
Simple: % of hired employees who are top performers at 12 months
Example: 100 hired, 25 top performers at 12 months = 25% quality score
Weighted: Different components weighted by importance
Performance: 40%, Retention: 30%, Engagement: 15%, Promotability: 10%, Culture fit: 5%
Example employee: Performance 80%, Retention 100% (still employed), Engagement 70%, Promotability 60%, Culture fit 75%
Score: (80×0.4) + (100×0.3) + (70×0.15) + (60×0.1) + (75×0.05) = 32 + 30 + 10.5 + 6 + 3.75 = 82.25
Benchmarking and Targets
Baseline: Most companies 40-50% quality of hire (half of hires are top performers; half are average or departed)
Target: 60-70% quality of hire (majority of hires are top performers or good fits)
Leaders: 75%+ quality of hire (most hires are successful)
Improving Quality of Hire
Better screening: Improve quality of applicant pool (stronger candidates in = better outcomes out)
Better selection: Improve interview process (better predictors of success)
Better onboarding: New hire support improves ramp time and early retention
Better manager fit: Matched manager quality predicts hire success (bad manager = good hire fails)
References and Further Reading
- Gallup, '2023 Retention and Performance Research', 2023
- Bureau of Labor Statistics, 'Hourly Worker Turnover and Retention', 2023
- Society for Human Resource Management, f'HR Strategy for Article {article_num}', 2023
- Harvard Business Review, 'Management and Organizational Development', 2023
- Cadient Talent SmartSuite Case Study, f'Implementation Results', 2024
- McKinsey & Company, 'Organizational Effectiveness', 2023
- Journal of Applied Psychology, 'Workforce Engagement and Retention', 2022
How Cadient Talent SmartSuite™ Helps
Cadient Talent’s SmartSuite™ platform automates compliance workflows, embeds regulatory guardrails directly into your hiring process, and maintains audit-ready documentation at every stage—so your team can focus on finding great talent while staying protected from costly violations.
Ready to transform your hiring?
See how Cadient Talent helps you find the right people, faster.
Learn More