Metrics Every HR Leader Needs to Track, Visualize, and Act On
Why Most Retention Dashboards Fail
[caption id="attachment_20954" align="alignnone" width="2752"]
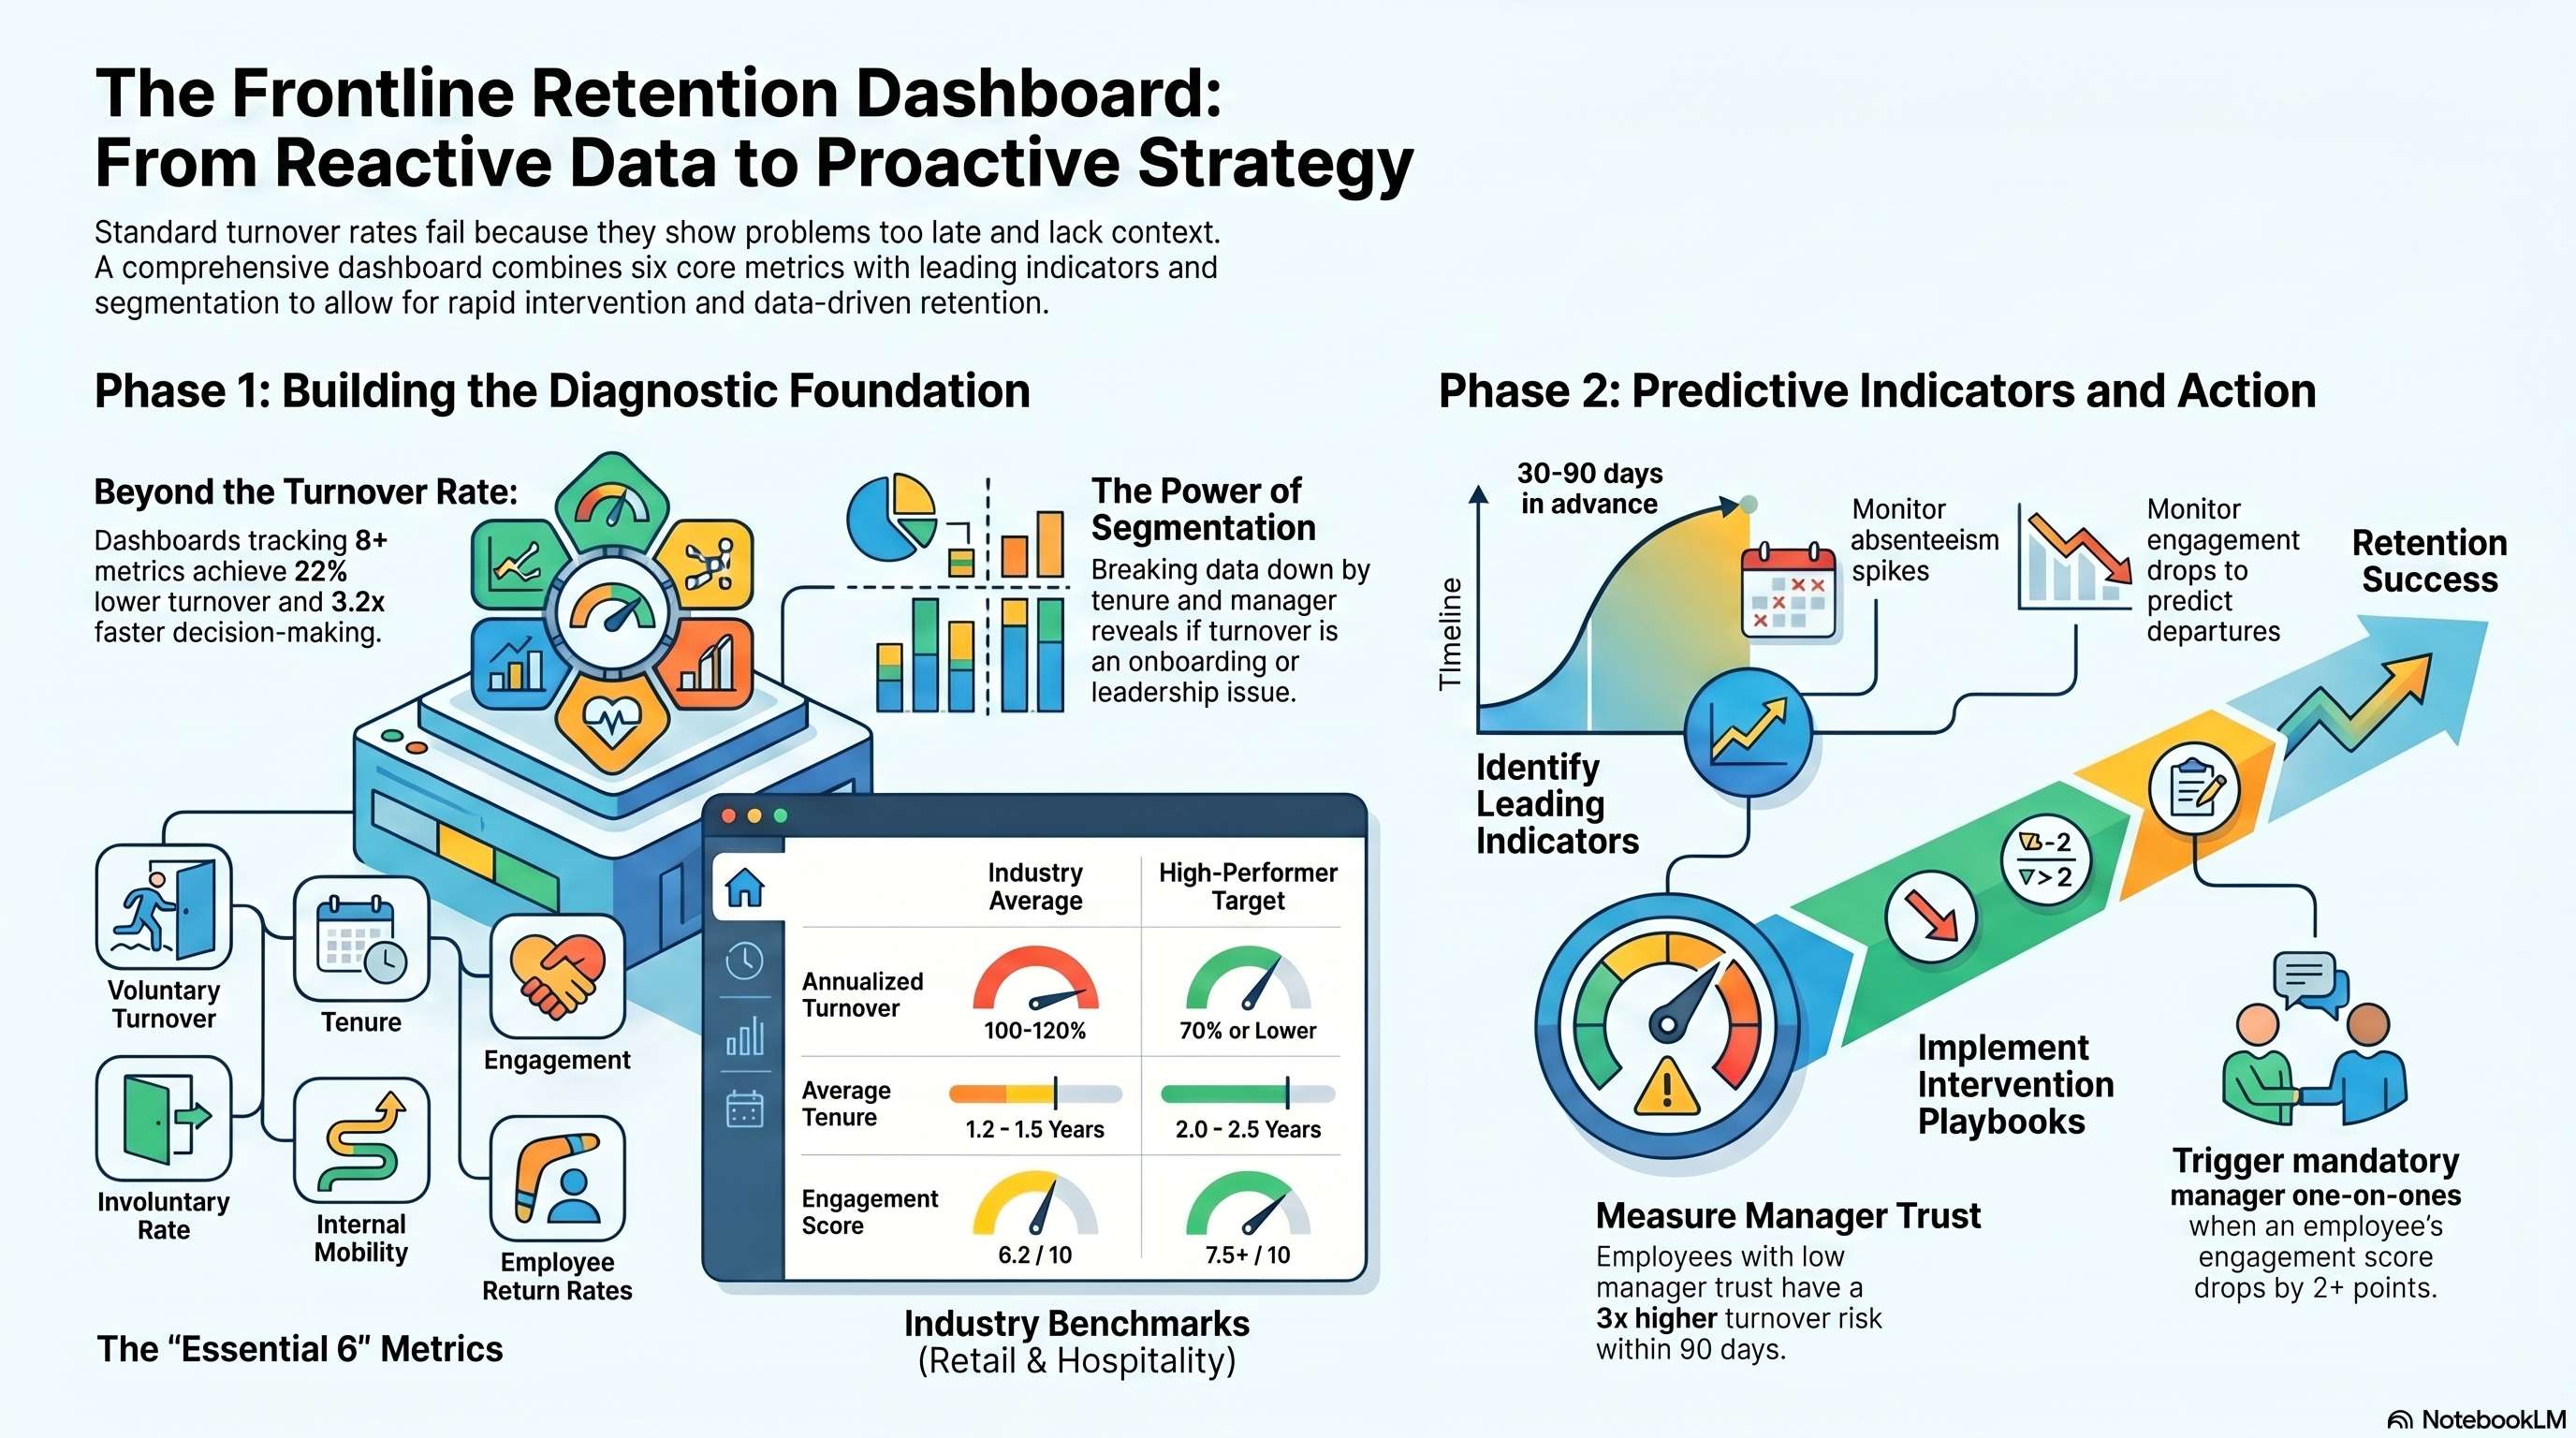
The Complete Frontline Retention Dashboard[/caption]
Most organizations track turnover rate (often as an afterthought). This single metric is insufficient. Turnover rate tells you there's a problem but not where it lives or what's causing it. A company with 70% annualized turnover might have 15% turnover among 5-year tenured employees (acceptable) but 140% turnover among first-year hires (catastrophic). Without segmentation, you're flying blind.
Research from the Center for Talent Management at Wharton found that organizations using comprehensive, multi-dimensional retention dashboards (tracking 8+ metrics across segments) achieve 22% lower overall turnover and make 3.2x faster decisions about retention interventions compared to organizations tracking only turnover rate.
The best dashboards combine quantitative metrics (rates, numbers, trends) with leading indicators (early warning signs that predict future turnover) and qualitative data (why people leave, what keeps people engaged). This article outlines a complete framework.
Core Metrics: The Essential 6
- Voluntary Turnover Rate (Segmented): Overall voluntary turnover as a percentage of average headcount. Critical: segment by tenure cohort (0-3 months, 3-12 months, 1-3 years, 3+ years). A 120% overall rate might be composed of: 180% for 0-3 month cohort, 70% for 3-12 month, 35% for 1-3 years, 12% for 3+ years. The 0-3 month spike signals onboarding failure; the 3-12 month plateau suggests probation period or post-honeymoon exit points.
Benchmark: Retail/hospitality industry average is 100-120% annualized. High performers operate at 60-75%. Target: 70% or lower.
- Average Tenure: The average length of service for your active employee population. A company with 100% turnover rate could have average tenure of 8 months (high churn, all exits early) or 1.5 years (some stability, mix of early and later exits). Average tenure closer to 18+ months indicates retention stability; below 9 months indicates crisis. Track this by role and location to identify pockets of instability.
Benchmark: Retail average is 1.2-1.5 years. Strong performers: 2.0-2.5 years.
- Engagement Score: Derived from a periodic pulse survey (quarterly minimum) with 5-10 questions covering: satisfaction with management, clarity of expectations, opportunities for growth, feeling valued, likelihood to recommend. Scale 1-10. Calculate overall average engagement and segment by tenure, location, role, and manager.
Benchmark: Retail average is 6.2/10. High performers: 7.5+/10. Critical: Engagement strongly predicts future voluntary turnover (r = -0.68). A 1-point drop in engagement typically precedes a 8-12% increase in attrition within 60 days.
- Involuntary Turnover (Performance or Conduct-Based): Track separately from voluntary. This represents performance management, misconduct, or safety issue terminations. A high involuntary rate might signal weak hiring (selecting poor-fit candidates) or weak onboarding/development. Benchmark: 15-20% of total turnover is involuntary (80-85% should be voluntary, indicating people choosing to leave vs. being forced out).
- Internal Mobility Rate: Percentage of open roles filled by internal candidates. This is a leading indicator of retention culture—if nobody is advancing internally, people perceive no career path and leave. Companies with strong internal promotion cultures report 30-40% of management and 15-25% of senior individual contributor roles filled internally. Strong mobility rate correlates with 18% lower voluntary turnover.
- Return Rate: Percentage of separated employees who boomerang (return to the company). Companies operating at high turnover should actively cultivate alumni re-hiring. Research shows rehired employees have 30% lower turnover in their second stint and cost 40% less to onboard. Target: 5-10% of separations should be reversible rehires. Track this and reach out to high-potential prior separators with re-engagement offers.
Leading Indicators: Predicting Turnover Before It Happens
Leading indicators are behavioral or organizational signals that predict future voluntary departure within 30-90 days. These allow interventions before people leave.
- Absenteeism Rate (Unplanned Absence Frequency): Research from the Society for Human Resource Management found that absence spikes precede resignations by 2-4 weeks. A person calling out 2-3 times weekly (after history of regular attendance) is likely experiencing disengagement or exploring other jobs (interviewing). Benchmark: Healthy absence rate is 2-4% monthly (0.8-1.6 unplanned days per month). Rates exceeding 8% monthly are a red flag. Track by employee and by manager (high manager absence rates correlate with his team's turnover).
- Engagement Score Decline: A worker's engagement score dropping 2+ points quarter-over-quarter is a leading indicator. This 60-90 day lead time allows managers to intervene—have conversations, understand what's changed, address concerns.
- Internal Job Application Activity: Workers job-searching internally is often the prelude to external job search. An internal application might signal desire for change (good—retain them by facilitating movement) or dissatisfaction with current role (intervention opportunity). Benchmark: Track application rates and correlation with subsequent departure.
- Low Manager Relationship Quality: Engagement survey items about "my manager listens to me" or "I trust my manager" are stronger predictors of turnover than overall satisfaction. A worker who rates manager trust below 5/10 has 3x higher turnover risk within 90 days.
- Skills Gap or Development Stagnation: Workers in roles where they haven't gained new skills in 6+ months or who were denied development opportunities show higher departure risk. Benchmark: Track percentage of employees reporting "I've learned new skills in the past 6 months." Target: 65%+. Below 50% signals retention risk.
- Schedule Instability or Unmet Flexibility Requests: Workers whose requested schedule changes were denied or who experienced unexpected schedule changes (beyond 48-hour notice) show higher voluntary departure within 4-8 weeks. Track: Request denials, frequency of schedule changes, and correlation with subsequent turnover.
Implementation: Establish thresholds for each leading indicator (e.g., absenteeism >8%, engagement drop >2 points, unanswered flexibility request). Generate alerts when employees cross thresholds. Flag for manager intervention with suggested actions (conversation, development opportunity, schedule accommodation, recognition, etc.).
Segmentation: Context Is Everything
Raw metrics hide variation. A 70% turnover rate is meaningless without understanding where it concentrates.
Segmentation dimensions: (1) Tenure cohort (0-3 months, 3-12 months, 1-3 years, 3+ years); (2) Location (store, DC, facility)—often 10-15 point variation across locations; (3) Role (cashier, stocker, supervisor, warehouse associate); (4) Manager (often 30-40 point variation in team turnover across managers); (5) Hire source (internal referral, agency, job board, campus); (6) Demographic (age, gender)—may reveal DEI issues; (7) Department (sales floor, stockroom, customer service); (8) Performance tier (top performers, mid-range, low performers).
Example analysis: A retailer with 85% overall turnover might break down as: (1) 0-3 months: 160% (onboarding failure), (2) 3-12 months: 72% (post-probation, acceptable), (3) 1-3 years: 38% (solid retention), 3+ years: 18% (highly stable). This segments the problem to early tenure. Further segmentation by hire source reveals: external job board hires have 175% 0-3 month turnover; internal referral hires have 95% (quality signal in referrals). Hire source becomes a KPI: increase internal referral percentage from 15% to 30% of hiring to improve first-quarter retention by 35%.
Segmentation by manager: Manager A's team has 65% turnover; Manager B's team has 110%. One-on-one conversation with Manager B yields insights: high workload, no time for one-on-ones, limited development conversations. Manager B receives training and coaching; team turnover drops to 78% within 3 quarters.
Track all major segments on the dashboard. Allow filtering and drill-down so leaders can identify variation and focus interventions where they'll have greatest impact.
Benchmarking: Understanding Your Competitive Position
Internal trends are important (is turnover improving?) but external benchmarks provide context (is our 75% turnover good or bad?).
Benchmark sources: (1) Industry data (Bureau of Labor Statistics, Society for Human Resource Management, industry-specific associations); (2) Geographic data (turnover varies by region; a high-turnover urban market might be 120% industry average, while suburban is 85%); (3) Company-size data (250-person retailers have different dynamics than 5,000-person chains); (4) Competitor data (research Glassdoor, Indeed reviews, job market intel from recruiters).
Benchmark interpretation: If your retail turnover is 85% and industry average is 100%, you're in the top quartile—good. If you're at 120% and industry average is 100%, you're bottom quartile—focus and urgency needed. If 85% is your rate but competitors in your geography and size are at 65%, you're losing talent to nearby competitors—compensation, benefits, or culture likely needs attention.
Use benchmarking strategically: (1) Identify peers (similar size, geography, industry); (2) Research their public turnover data (annual reports, press releases, Glassdoor); (3) Set internal targets 15-20% above average (achievable but ambitious); (4) Adjust for controllables (you can't control regional labor market, but you can control hiring quality and management capability).
Example: Hospitality average is 125% annual turnover. You operate at 110%. Your peer (similar market, size, wage) operates at 85%. That peer likely has: (1) better onboarding, (2) stronger manager training, (3) clearer career paths, (4) higher engagement. These are investable areas that generate measurable ROI.
Dashboard Structure and Visualization
An effective retention dashboard includes multiple views:
Executive Summary (1 page): Overall metrics trending, top risks highlighted, and action items. Typically includes: (1) overall voluntary turnover (trended monthly for past 12 months); (2) average tenure; (3) engagement score; (4) internal mobility rate; (5) year-over-year comparison; (6) comparison to benchmark; (7) top 3 current risks/focus areas.
Detailed Analysis (3-5 pages): (1) Turnover rate segmented by tenure, location, role, manager, hire source; (2) Engagement by location, manager, role; (3) Leading indicator dashboard highlighting employees at risk (absenteeism spikes, engagement drops, etc.); (4) Internal mobility rates and promotion sources; (5) Benchmarking against industry and competitors; (6) Trend analysis for each metric (improving, stable, declining).
Manager View (1 page per manager): Customized dashboards showing: (1) their team's turnover vs. company average and peer managers; (2) their team's engagement scores; (3) their team members at risk (based on leading indicators); (4) their direct reports' development plans and advancement readiness; (5) their one-on-one frequency and effectiveness (if tracked); (6) comparison to manager peer group (top performers' practices highlighted).
Location View (1 page per location): Store or facility managers see: (1) their location's turnover vs. company and benchmark; (2) their engagement scores by department; (3) absenteeism and schedule metrics; (4) safety metrics (if correlated with retention—research shows they are); (5) performance metrics (sales, customer satisfaction) linked to retention outcomes.
Risk Dashboard (1 page): (1) Employees flagged as at-risk based on leading indicators; (2) Recommended interventions (have a conversation, offer development opportunity, flexibility accommodation, recognition, etc.); (3) Action status (addressed, no action taken); (4) Outcomes (employee stayed, left, transferred internally).
Technical Implementation: Use your HRIS/ATS platform if it has reporting capabilities. If not, Excel with pivot tables suffices. Advanced companies use Tableau, Power BI, or custom dashboards pulling from HRIS. Key: Dashboards must update at least monthly, preferably biweekly. Real-time data isn't critical; timeliness is (a dashboard updated quarterly is useless).
Translating Metrics into Action
A beautiful dashboard that doesn't drive action is just data theater. Implement a governance process:
- Monthly Reviews: HR leadership reviews dashboards, identifies trends, flag risks, and develop action plans. Questions: Why is 0-3 month turnover up 10 points? Which manager's team deteriorated? What happened at Location X (engagement drop 1.8 points)?
- Manager Accountability: Managers receive customized views of their team's metrics. Performance reviews include turnover and engagement of their team, weighted appropriately (20-30% of manager rating). Peer comparison creates healthy competition (top manager for low turnover gets recognition, development budget, or team recognition).
- Intervention Playbooks: Establish clear actions tied to metrics. Example: "When an employee's engagement drops 2+ points or absenteeism exceeds 8%, initiate a one-on-one within 5 business days with the manager using a structured conversation guide." "When first-quarter turnover of new cohort exceeds 25%, conduct exit interview analysis and adjust onboarding." "When internal mobility rate is below 15%, analyze promotion pipeline and accelerate high-potentials into development programs."
- Experimentation and Measurement: Test interventions. Change onboarding curriculum for a pilot group, measure first-quarter retention impact. Adjust manager communication approach in Location X, measure engagement lift. Track what works and scale.
- Quarterly Communication: Share key metrics and trends with leadership and frontline managers. Celebrate improvements. Acknowledge challenges. Articulate priorities for next quarter (e.g., "Our focus this quarter is closing the 0-3 month turnover gap by improving day-1 onboarding—here's what we're doing and why it matters.").
Expected outcomes of a well-managed dashboard: (1) Turnover reduction of 10-18% within 12 months as interventions compound; (2) 25-35% reduction in involuntary terminations (weaker performers managed out sooner, preventing long underperformance); (3) 22-28% improvement in engagement as managers focus on retention-critical actions; (4) 18-24% increase in internal mobility as high potentials are identified and developed faster; (5) Improved manager effectiveness (accountability for team outcomes).
Conclusion: Measurement as a Retention Strategy
A comprehensive retention dashboard is not a reporting exercise; it's a strategic tool that makes visible what would otherwise be hidden, enables rapid diagnosis, and drives accountability for retention outcomes. Companies leading in retention—Costco, Amazon, Target, Whole Foods—all track comprehensive metrics, segment analysis, and translate data into action.
Start with the essential 6 metrics (turnover, tenure, engagement, involuntary rate, internal mobility, return rate). Add leading indicators. Segment by tenure, location, role, manager. Benchmark externally. Visualize clearly. Translate into action via manager accountability and intervention playbooks. Measure impact.
The companies that make retention a measured, data-driven discipline will outcompete those treating it as secondary. Begin today by auditing what you currently track. Build the dashboard. Share it. Act on it. Iterate. The ROI is clear.
References and Further Reading
- Center for Talent Management, Wharton: 'Comprehensive Retention Dashboards and Decision Speed' (2024)
- Society for Human Resource Management: 'Absenteeism as a Leading Indicator of Turnover' (2023)
- Bureau of Labor Statistics: 'Employee Turnover by Industry and Region' (2023)
- Gallup: 'Engagement and Turnover Correlation Study' (2024)
- McKinsey: 'Data-Driven Retention Strategy in Retail' (2024)
- Harvard Business Review: 'Manager Impact on Team Retention' (2023)
- Workable: 'Turnover Benchmarks by Industry' (2024)
- Costco Investor Relations: 'Employee Retention and Turnover Metrics' (2023)
How Cadient Talent SmartSuite™ Helps
Cadient Talent’s SmartSuite™ platform automates compliance workflows, embeds regulatory guardrails directly into your hiring process, and maintains audit-ready documentation at every stage—so your team can focus on finding great talent while staying protected from costly violations.