A CFO-Friendly Breakdown of Why Quality Hiring Matters
The Total Cost of a Bad Hire
[caption id="attachment_20923" align="alignnone" width="2752"]
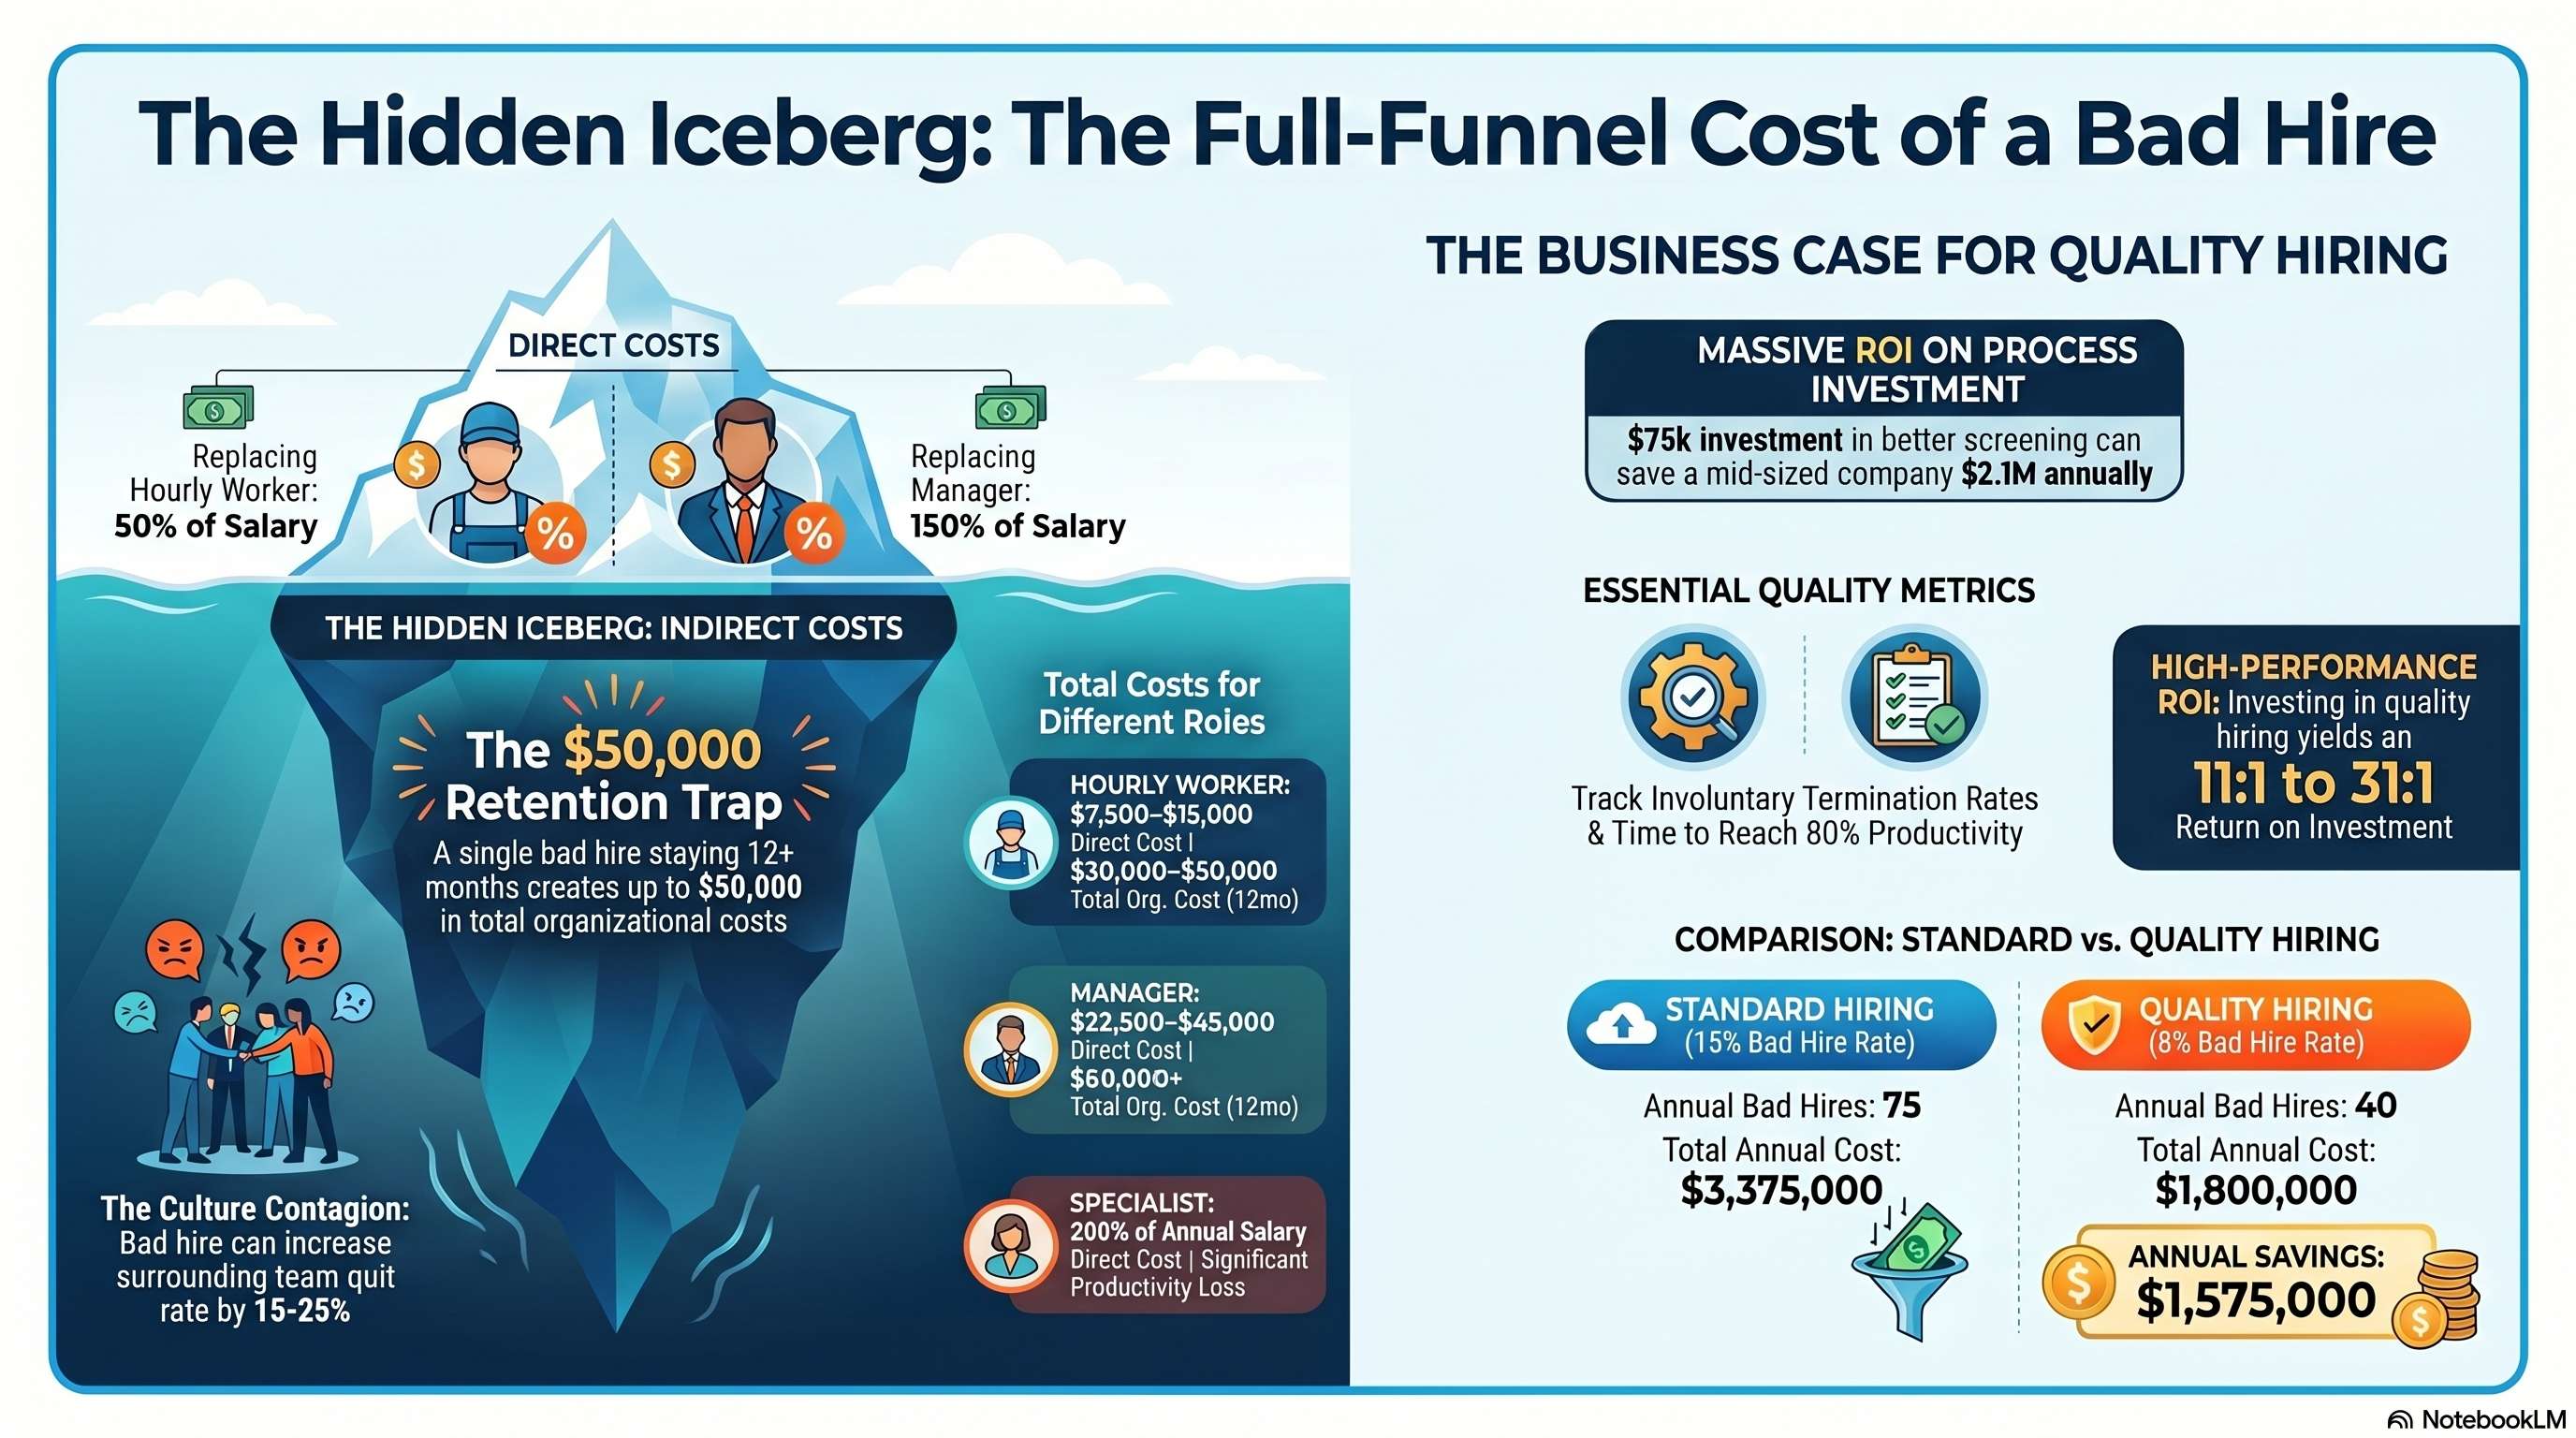
The Full-Funnel Cost of a Bad Hire[/caption]
A bad hire costs far more than simply replacing them. Direct costs (recruiting, onboarding, training) plus indirect costs (productivity loss, team disruption, customer impact, management time) compound quickly. Estimates vary by role and industry, but the Society for Human Resource Management calculates that replacing an hourly employee costs 50% of annual salary (range: $7,500-$15,000); replacing a manager costs 150% of annual salary (range: $22,500-$45,000); replacing a specialist costs 200%+ of annual salary.
But these replacements are only the visible tip. A bad hire who stays in a role creates ongoing drag: Lower productivity than replacement, team productivity loss from their behavior, customer satisfaction impact, management time addressing issues, potential liability from misconduct or safety violations. Research from the Center for Talent Management found that a single bad hire staying 12+ months in a frontline role creates $30,000-$50,000 in total organizational cost (combination of direct replacement of that role plus indirect productivity and team impact).
Direct Costs: Replacing a Bad Hire
Recruiting: Job posting, recruiter time, screening, interviews. For an hourly role: 15-20 hours of recruiter time at $50/hour = $750-$1,000. Plus job board costs ($200-$500), recruiter fees (15-25% of salary if using agency). Total recruiting cost for $16/hour hourly role: $1,200-$2,500.
Onboarding and Training: First-week orientation (2-3 days at full productivity), role-specific training (3-5 days at 50% productivity), ramp-to-productivity (weeks 2-8 at gradually increasing productivity). A retailer might invest 40-50 hours of trainer/manager time. At average trainer cost ($40/hour loaded), that's $1,600-$2,000 in trainer time. Plus materials, systems setup, supplies: $200-$500.
Productivity Loss: New hires reach 80% of expected productivity by week 8, then ramp slowly to 100% by month 4-6. Total productivity loss for first 6 months: 20-40% for first month, 15% for months 2-3, 10% for months 4-6. For a $35K-$40K annual role, that's $8,000-$12,000 in lost productivity over 6 months.
Total direct cost for replacing hourly role: $11,000-$17,000.
For a manager role (typical $60K salary): Recruiting costs $3,000-$5,000. Onboarding/training 8-10 weeks, productivity loss 40-50% for first month, 30-35% months 2-8. Total productivity loss: $15,000-$20,000. Plus opportunity cost of role being vacant 3-4 weeks during search. Total direct cost: $25,000-$35,000.
Indirect Costs: Team and Customer Impact
Bad hire characteristics that create indirect cost: (1) Low performer—misses targets, creates rework, requires constant management; (2) Poor fit—cultural misalignment, negative attitude, disruptive behavior; (3) Safety concern—accident-prone, rule-breaking; (4) Customer interaction issue—rude, incompetent, drives customers away.
Team Impact: A bad hire lowers team morale, increases turnover of good performers (who leave rather than work alongside bad performer), creates additional management burden. Research shows a single bad hire increases quit rate of team by 15-25% within 6 months. For a 10-person team, that's 1.5-2.5 additional quits attributable to bad hire. At $7,500-$10,000 per hourly replacement, that's $11,000-$25,000 in additional turnover cost.
Customer Impact: A bad hire with customer-facing responsibility drives negative reviews, reduces customer satisfaction, damages brand. A retail associate with poor customer service skills reduces store satisfaction by 2-3 points (on 10-point scale), correlating to 3-5% reduction in repeat customers. For a store generating $2M annual revenue with 25% gross margin, that's $15,000-$25,000 in lost annual margin attributable to one bad hire.
Management Time: Addressing performance issues, documenting concerns, conducting performance improvement plans, handling interpersonal conflicts—a bad hire requires 5-10 hours/month of manager time (vs. 1-2 hours for good performer). Over 12 months, that's 48-120 hours. At manager cost of $55/hour loaded, that's $2,600-$6,600.
Total indirect cost of a bad hire staying 12 months: $25,000-$55,000.
Scenario Analysis: Cost of Bad Hires at Scale
Scenario 1 – 500-person retailer with 100% annual turnover (500 hires annually). Assume 15% of new hires are "bad hires" (poor performers, poor fits, require termination within 6-12 months). That's 75 bad hires annually. Cost per bad hire (6-month tenure before termination): $15,000 direct + $30,000 indirect = $45,000. Total annual cost of bad hires: 75 × $45,000 = $3,375,000.
Scenario 2 – Same retailer improves hiring quality. Reduce bad hire rate from 15% to 8% (investing in better screening, structured interviews, culture fit assessment). New bad hire count: 40 annually. Cost: 40 × $45,000 = $1,800,000. Savings: $1,575,000. Program cost (better recruiting, assessment tools, training): $100,000. Net benefit: $1,475,000 annually.
Scenario 3 – Extend to show impact on turnover and profitability. By reducing bad hires 7% of hiring volume, you reduce involuntary terminations (those fired for poor performance) by 35 people. These 35 people, if they had stayed and underperformed, would have generated $525,000 in drag (productivity loss, team impact, customer impact). Plus, by filtering out poor fits early, you prevent cascading departures. Reduce voluntary turnover by 5% (from preventing bad-hire team impact) = 25 fewer departures. At $7,500 replacement cost per hourly worker, that's $187,500 saved. Total savings from better hiring: $1,475,000 + $525,000 + $187,500 = $2,187,500 annually.
Quality Metrics That Prevent Bad Hires
KPIs to track bad hire rate: (1) Involuntary termination rate (% of new hires terminated for performance/conduct within 12 months); Benchmark: 8-10% is acceptable; >15% indicates poor hiring quality. (2) First-90-day performance assessment failure rate (% of new hires scoring below performance threshold by day 90); Target: <8%. (3) Manager assessment of new hire quality (survey managers: "How many new hires in your area are meeting or exceeding expectations?); Target: >85%. (4) Team feedback on new hire fit; Target: >75% of teams rate new hires positively. (5) Productivity ramp (% reaching 80% productivity by week 8); Target: >80%. (6) Correlation between hiring quality score and retention/performance; should show strong positive correlation (better-screened candidates perform better, stay longer).
Investing in Quality to Reduce Bad Hires
Specific investments that reduce bad hire rate: (1) Structured interviews and assessment tools: $15,000-$25,000 initial setup, $3,000-$5,000 annually; ROI: Reduces bad hires by 5-8%; 500-person company saves $225,000-$360,000 annually. (2) Better sourcing and candidate screening: $30,000-$50,000 annually in recruiter time/tools; ROI: Improves candidate quality by 3-5 percentage points; saves $135,000-$225,000 annually. (3) Reference checking and background verification: $50-$150 per candidate; ROI: Catches issues 15-25% of time; prevents bad hires costing $7,500-$45,000 each. (4) Culture fit assessment: $5,000-$10,000 for tool; ROI: Reduces bad-fit hires by 20-30%; 500-person company with 75 bad hires annually saves $675,000-$1,012,500.
Total investment to reduce bad hires: $50,000-$90,000 annually for 500-person org. Benefit: $1,035,000-$1,597,500 annually. ROI: 11:1 to 31:1.
CFO-Friendly Presentation
Framing for finance: "We're losing $2-3M annually to bad hires (15% of hiring population costing $30-45K each). By investing $75K in better hiring processes, we can reduce bad hire rate to 8%, saving $1.4-2.1M annually. This is the highest-ROI HR investment we can make."
Metrics for CFO: (1) Bad hire cost as % of payroll; (2) Bad hire rate trending; (3) Program cost vs. savings; (4) Payback period (months); (5) Impact on involuntary turnover and team turnover (which cascade into costs); (6) Impact on productivity and customer satisfaction (which correlate to revenue).
Link to revenue: A 15% reduction in bad hires improves overall hiring quality, reduces team disruption, improves customer experience, and drives incremental revenue. For a 500-person operation with $100M annual revenue, a 1% revenue improvement from better hiring quality and team stability = $1M additional revenue. Gross margin on incremental revenue: $300K-$400K. Program cost: $75K. Net benefit: $225K-$325K from revenue impact alone (before accounting for direct cost savings).
Conclusion: Bad Hires Are Expensive
The total cost of a bad hire—direct recruiting and onboarding, plus indirect team disruption, customer impact, management time, and cascading turnover—ranges from $25,000-$50,000 per bad hire depending on role and tenure. For high-volume organizations, bad hiring at 15% rates creates millions in annual cost.
Investing in better hiring processes (assessment tools, structured interviews, better sourcing, culture fit evaluation) costs $50K-$100K annually for mid-sized organization but generates $1-3M in annual benefit. The ROI is undeniable.
CFOs should view hiring quality as a strategic investment with measurable return. HR leaders should present bad hire costs and prevention benefits in financial terms, making the business case for investment in hiring quality.
References and Further Reading
- Society for Human Resource Management: 'Cost of Bad Hires' (2023)
- Center for Talent Management: 'Bad Hire Cost Analysis' (2024)
- McKinsey: 'Hiring Quality and Organizational Performance' (2024)
- Harvard Business Review: 'Cost of Turnover and Bad Hires' (2023)
- Deloitte: 'Quality of Hire Metrics' (2024)
- Workable: 'Bad Hire Cost Calculator' (2023)
How Cadient Talent SmartSuite™ Helps
Cadient Talent’s SmartSuite™ platform automates compliance workflows, embeds regulatory guardrails directly into your hiring process, and maintains audit-ready documentation at every stage—so your team can focus on finding great talent while staying protected from costly violations.