Understanding the recruiting funnel math that separates successful high-volume hiring from broken processes
The Brutal Truth About Recruiting Funnels
Every year, companies in retail, hospitality, logistics, and manufacturing claim they're struggling to fill positions. The conversations always sound the same: 'We don't get enough applications.' 'The candidates we attract aren't qualified.' 'Our offer acceptance rate is terrible.' But these statements mask a more fundamental problem—most organizations have never actually calculated what their recruiting funnel looks like.
When we work with Cadient Talent clients, one of the first metrics we analyze is the applicant-to-hire ratio. The industry-wide average? Approximately 180 applicants needed to generate one hire. This number shocks most HR leaders. 'That can't be right,' they say. But the research is consistent across decades and industries. And here's what's worse: most companies don't know their own ratio. They hire people, but they can't articulate the actual funnel efficiency that made it happen.
Understanding your recruiting funnel—and the math behind it—is the foundation of every scaling hiring operation. Without this baseline, you're flying blind. You can't optimize what you don't measure. And you can't build a predictable high-volume hiring machine if you're operating on gut feel instead of data.
The Five Stages of the Recruiting Funnel
Let's define the funnel stages clearly, because terminology matters. Each stage has industry benchmarks you can measure yourself against.
Stage 1: Applications
This is the top of the funnel. A candidate clicks 'apply' on your job posting.
Industry benchmark (retail/hospitality): 100% baseline. This is where you measure everything else from.
Cadient insight: Most companies under-source here. A single job board, slow application process, or unclear job descriptions cut your pipeline by 40-50% before anyone is even screened.
Stage 2: Screenings Completed
A recruiter or ATS system reviews the application and determines basic fit: skills, availability, location.
Industry benchmark: 25-35% of applicants advance to phone/video screening.
What's happening: The other 65-75% are rejected for missing hard requirements (retail hours available, willing to work weekends, valid driver's license, etc.).
Stage 3: Interviews Scheduled
The candidate confirms a time slot for a first-round interview (phone, video, or in-person).
Industry benchmark: 40-50% of screened candidates actually show up for scheduled interviews.
Reality check: No-shows and cancellations are endemic in high-volume hiring. A candidate accepted a job elsewhere. Their ride fell through. They forgot. The benchmark accounts for this attrition.
Stage 4: Offers Extended
After interviews (sometimes multiple rounds), the company extends a formal offer.
Industry benchmark: 35-45% of interviewed candidates receive offers.
What this means: Not all interviewed candidates are ready for hire. Some fail cultural fit, some bomb the interview, some have resume gaps that don't check out.
Stage 5: Offers Accepted / Hires
The candidate signs the offer and becomes a hire.
Industry benchmark: 70-80% of offers are accepted in retail/hospitality (lower in other sectors).
The math: If only 70% accept, you need to extend more offers than you have headcount to fill.
The 180-to-1 Math in Action
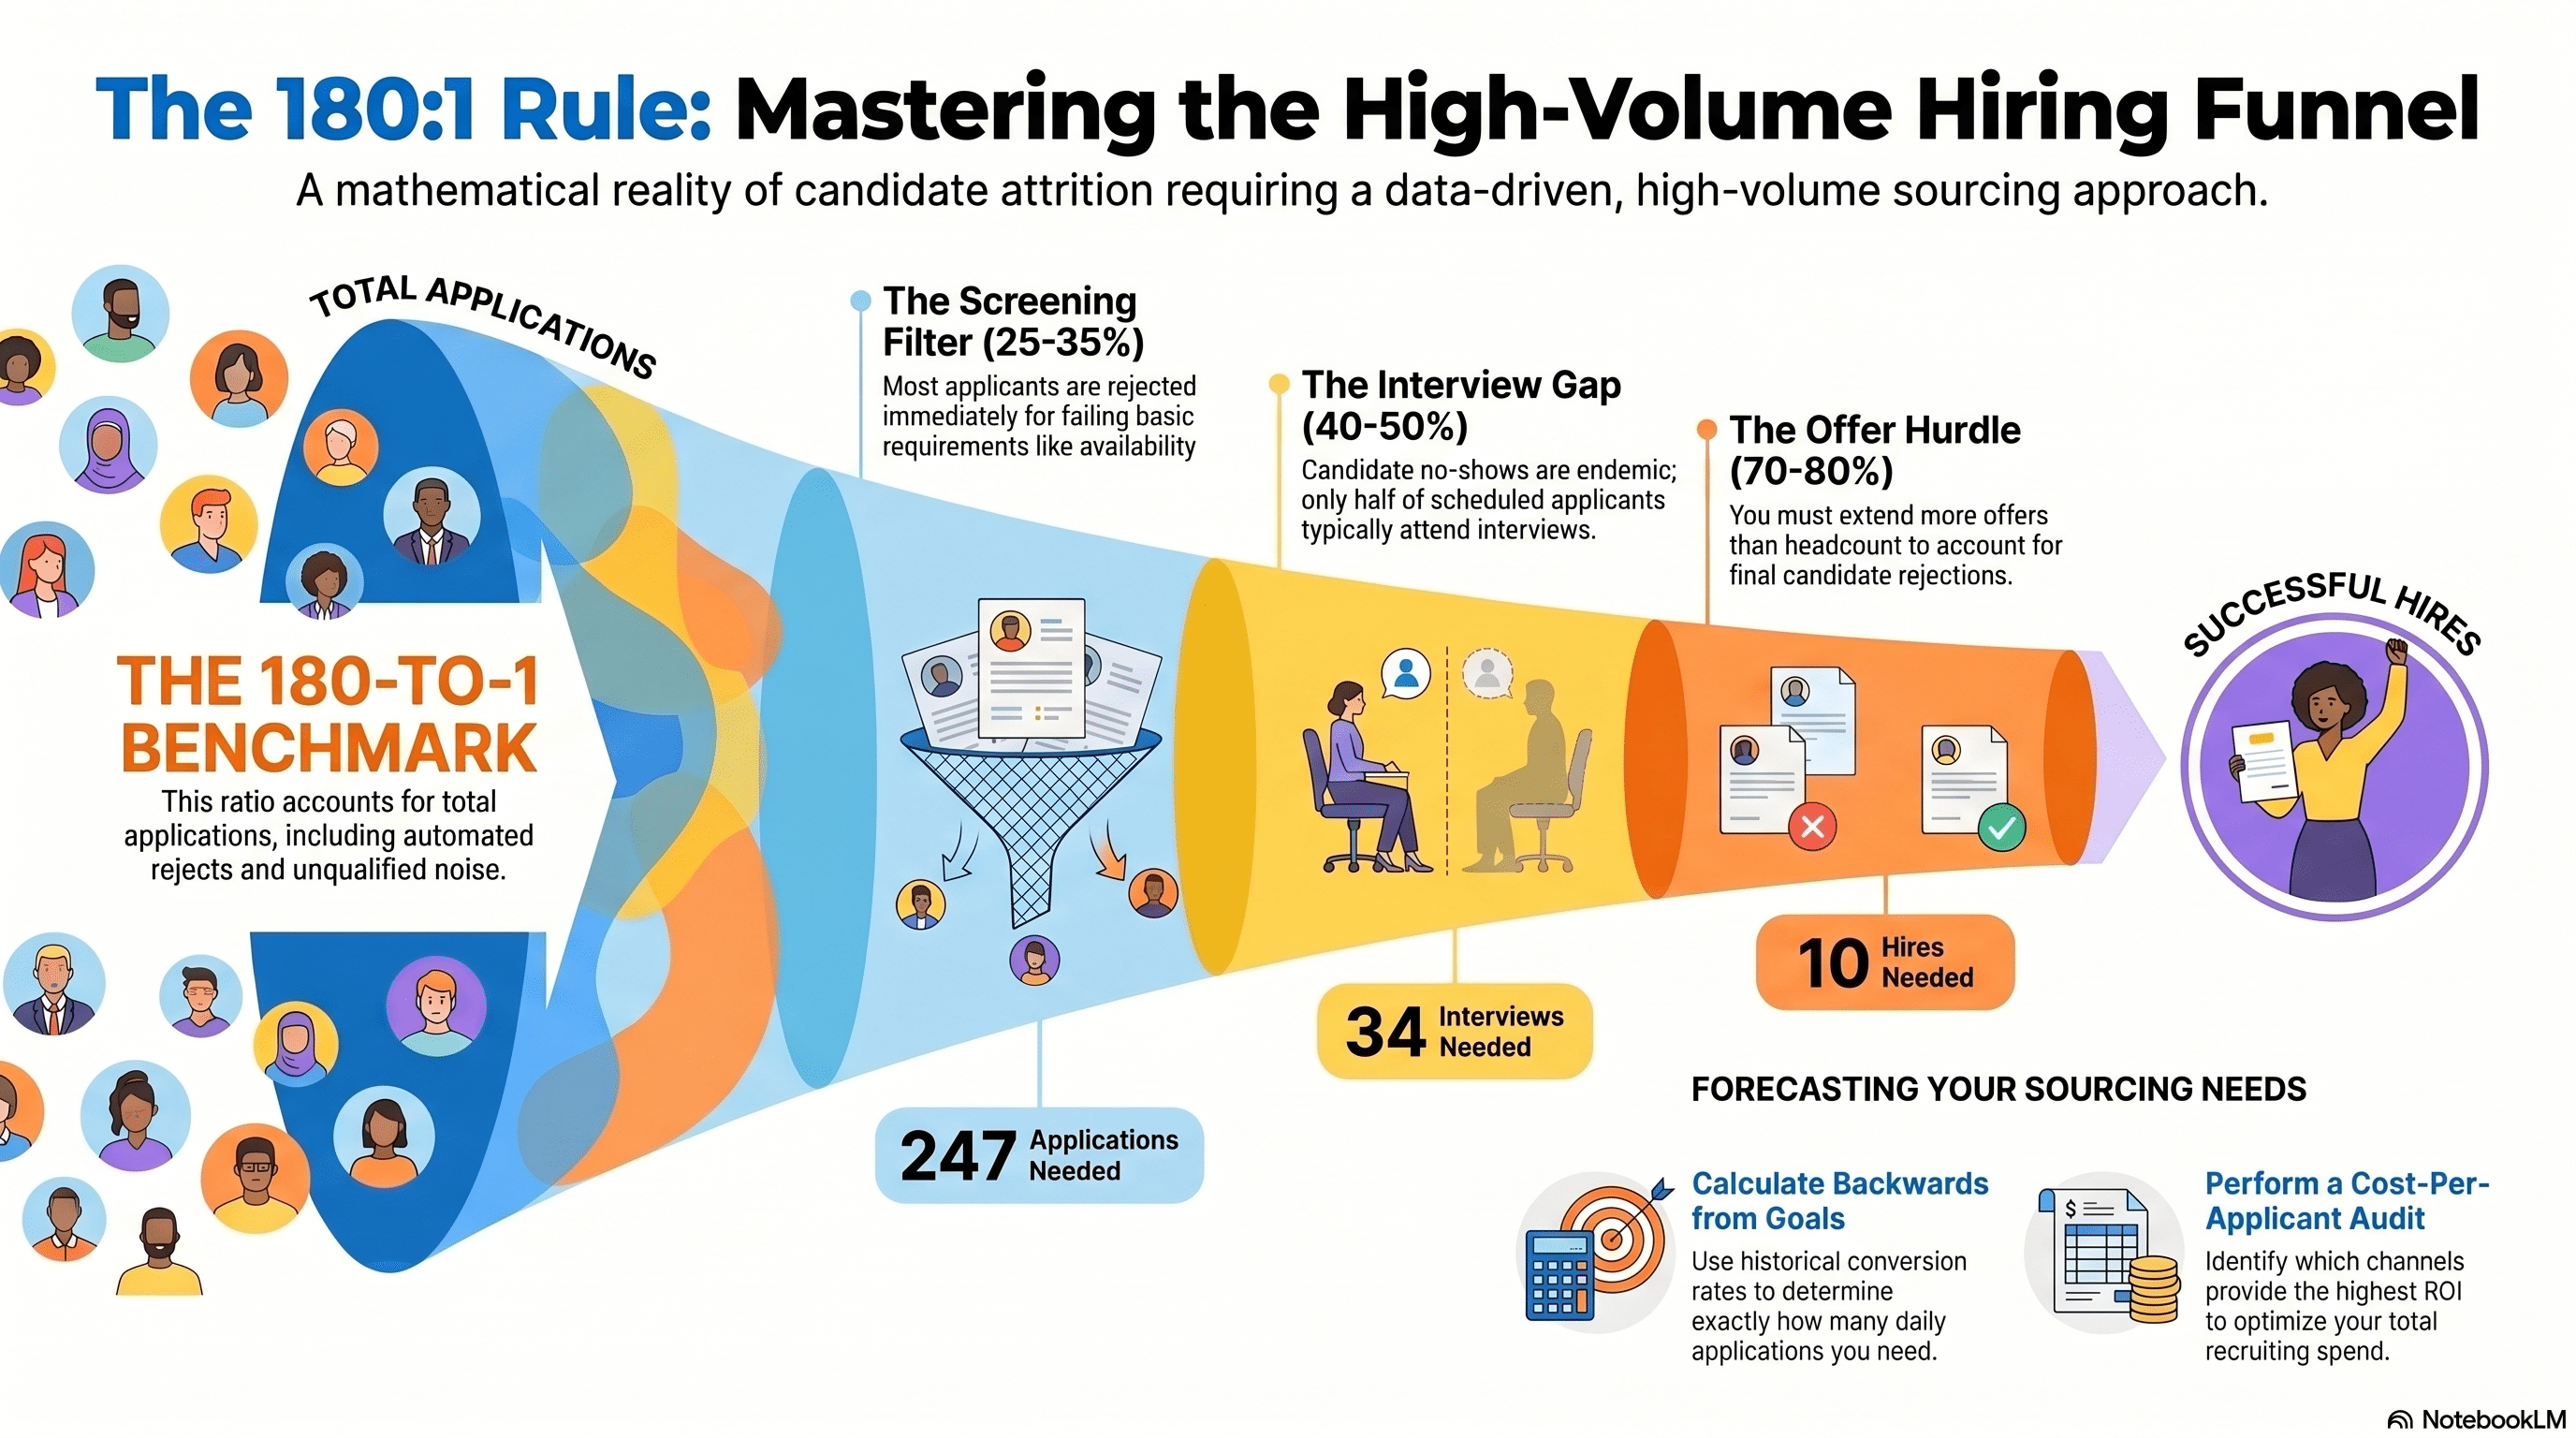
Now let's walk through a real example using these benchmarks. Imagine you need to fill 10 retail positions.
Working backward from your goal:
- 10 hires needed ÷ 0.75 (offer acceptance rate) = 13.3 offers needed
- 13.3 offers ÷ 0.40 (interview-to-offer rate) = 33.3 interviews needed
- 33.3 interviews ÷ 0.45 (screening-to-interview rate) = 74 screenings needed
- 74 screenings ÷ 0.30 (application-to-screening rate) = 247 applications needed
So you actually need roughly 247 applications to reliably fill 10 positions. That's 24.7 applicants per hire—but we said 180-to-1 at the top. What's the difference?
The 180-to-1 benchmark includes all applications received across all job postings, including those that never advance beyond an automated ATS reject, those from candidates who don't meet minimum requirements, and applications to positions that eventually get filled differently (internal transfers, contractor roles, etc.). It accounts for the noise in a real-world high-volume operation.
Your actual funnel ratio depends on your hiring criteria, sourcing quality, and process design. But the principle holds: expect to source significantly more volume than your headcount need. Build your sourcing strategy around that reality.
Why Most Companies Get the Funnel Wrong
Three mistakes are almost universal:
Mistake 1: Assuming quality over quantity. Many companies believe they can source a smaller pipeline and just hire 'better.' This backfires spectacularly in high-volume sectors. Retail and hospitality need volume. You can't fill a 100-person distribution center with only 20 applications, no matter how good those candidates are. The math doesn't work. You need both quality AND volume. They're not mutually exclusive.
Mistake 2: Not accounting for no-shows and offer rejections. Companies build hiring plans based on interview slots, not applications. 'We have 5 interviews scheduled, so we're on track.' But 40% won't show up. Only 40% of no-shows will convert to offers. Only 75% of offers accept. Suddenly that interview pipeline is half what you thought.
Mistake 3: Measuring the wrong stage. Most companies count job posts, not applications. 'We posted the position on Indeed and LinkedIn.' Great. How many applications did you get? From where? At what cost? If you posted the same role on 5 channels and got 180 applications, but 160 came from one channel, you're wasting budget and effort on the others. Measure applications by source, screening rate by job type, interview-to-offer rate by hiring manager. Measure the funnel.
The companies that scale hiring successfully obsess over these metrics. They know exactly what their funnel looks like, where the leaks are, and how to plug them.
Calculating Your True Funnel Ratio
Here's how to compute your actual funnel efficiency:
- Pick a time period (last quarter, last year, last 12 months).
- Count applications received across all job postings: This is your starting point.
- Count completed screenings: How many applications made it past your initial review?
- Count scheduled interviews: How many candidates confirmed a time slot?
- Count offers extended: How many interview candidates advanced to offer stage?
- Count hires: How many offers were accepted and the person started?
- Calculate each stage's conversion rate: Screenings ÷ Applications; Interviews ÷ Screenings; etc.
- Calculate the overall ratio: Total applications ÷ Total hires = Your funnel ratio.
Example: 3,650 applications, 180 hires = 20.3-to-1 ratio.
That number is gold. It tells you exactly what sourcing volume you need to hit your hiring goals. If your funnel is 20-to-1 and you need 50 hires, you need 1,000 applications. If you're only sourcing 500, no wonder you're short-staffed.
Post this ratio publicly on your recruiting team's dashboard. Update it monthly. Use it to set sourcing targets. Build your entire hiring strategy around it. This single metric will transform your hiring predictability.
The Cost-Per-Applicant Analysis
Once you know your funnel ratio, the next critical insight is understanding what each applicant costs you.
Let's say your total recruiting spend (job board fees, HR software, internal recruiting time, hiring manager time) is $40,000 per quarter. And you sourced 2,000 applications in that quarter.
Cost per applicant: $40,000 ÷ 2,000 = $20 per application.
Now, if your funnel is 20-to-1 and you hire 100 people, your cost-per-hire is $20 × 20 = $400 per hire.
But here's where it gets interesting. Not all applications are equal.
If you source 500 applications from your career site (free), 800 from Indeed (paid at $100/week), 400 from a niche job board ($2,000/month), and 300 from employee referrals (free incentive), the cost per application varies wildly:
- Career site: $0 per application
- Indeed: $1.92 per application ($100/week ÷ 52 weeks × 10 weeks averaged ÷ 800 apps)
- Niche board: $18.33 per application
- Referrals: $0 (if your referral bonus is part of the $40k or separate)
This analysis reveals channel efficiency. Employee referrals cost nothing and probably convert better (referral hires have higher retention). Your niche board is expensive. Your career site is free but getting no traffic. You can now optimize your sourcing spend based on data, not intuition.
Most companies don't do this. They keep paying for low-ROI channels because 'we've always posted there.' A quarterly cost-per-applicant audit is the fastest way to improve your funnel efficiency without increasing total spend.
Using Funnel Math to Set Realistic Hiring Goals
The biggest value of understanding your funnel is predictability. Once you know your numbers, you can forecast hiring outcomes with real confidence.
Example scenario: Your VP of Ops asks HR to hire 45 people in the next 8 weeks for a new warehouse opening. Most HR teams immediately start panicking or over-promising.
Instead, you pull your funnel ratio (let's say it's 25-to-1). You know you need:
- 45 hires ÷ 0.75 (offer acceptance) = 60 offers
- 60 offers ÷ 0.40 (interview-to-offer) = 150 interviews
- 150 interviews ÷ 0.45 (screening-to-interview) = 333 screenings
- 333 screenings ÷ 0.30 (application-to-screening) = 1,110 applications needed
So you need 1,110 applications in 8 weeks = 138 applications per week, or 28 per day.
Can your current sourcing channels deliver 28 applications per day? If not, you need to activate new channels (social media, job board promotions, employee referral push, direct outreach). If yes, you're on track.
This math-based conversation changes the dynamic entirely. Instead of 'Can you hire faster?' the conversation becomes 'How do we source 1,100+ applications?' It shifts from speed to volume, which is the real lever in high-volume hiring.
The hiring plan becomes realistic and time-bound. The sourcing team knows exactly what they need to deliver. The ops team understands the resource constraints. Expectations align. Disappointment decreases. Hiring succeeds.
The Funnel as Your Hiring North Star
Understanding your recruiting funnel isn't a one-time exercise. It's the foundation of a data-driven hiring operation.
Here's what great organizations do quarterly:
- Calculate and publish the funnel ratio: What was our actual applications-to-hires ratio this quarter?
- Identify bottlenecks: Which stage is most broken? If your screening-to-interview rate is only 20% (industry average is 40-50%), your screening criteria might be too strict. If your offer-acceptance rate is 60% (below the 70-75% benchmark), your offer might not be competitive.
- Optimize the worst stage: Improve one thing at a time. If screening is broken, redesign the screening questions. If interview-to-offer is weak, look at hiring manager consistency or interview training.
- Predict what funnel improvement means: If you improve your offer-acceptance rate from 70% to 80%, that's a 12.5% reduction in the offers you need. That's massive. It flows backward through the entire funnel and reduces your sourcing burden significantly.
- Build sourcing strategy around the funnel: Don't source randomly. Source to fill the funnel based on your historical conversion rates and your hiring goals.
The companies that hire at scale—100+ people per quarter—all do this. They think in funnels. They measure ruthlessly. They optimize continuously. The 180-to-1 benchmark isn't a target to beat; it's a reminder that high-volume hiring requires high-volume sourcing. Accept that reality. Build your infrastructure around it. Measure your funnel. Optimize what matters. Hire at scale.
References and Further Reading
- LinkedIn Talent Solutions. (2023). 'State of Recruiting Report.' Data on hiring funnel benchmarks across industries.
- SHRM. (2023). 'Talent Acquisition and Staffing Survey.' Applications and offers in high-volume sectors.
- Harvard Business Review. (2022). 'Why Your Recruiting Pipeline Is Broken' by Histock et al. Funnel attrition analysis.
- Indeed Hiring Lab. (2024). 'Application Volume and Conversion Trends.' Indeed user data on job posting performance.
- Glassdoor Economic Research. (2023). 'Hiring Benchmarks by Industry.' Application-to-hire ratios in retail and hospitality.
- ERE Media. (2023). 'The Cost and Effectiveness of Different Sourcing Channels.' Cost-per-applicant analysis.
- Society for Human Resource Management (SHRM). (2022). 'SHRM Compensation and Benefits Outlook.' Hiring volume trends in logistics and manufacturing.
How Cadient Talent SmartSuite™ Helps
Cadient Talent’s SmartSuite™ platform automates compliance workflows, embeds regulatory guardrails directly into your hiring process, and maintains audit-ready documentation at every stage—so your team can focus on finding great talent while staying protected from costly violations.