Decline reason categorization, exit survey methodology, and using decline feedback to improve offers and hiring strategy.
The Data Gap: Why Decline Reasons Matter
A recruiter extends 100 offers. 70 are accepted, 30 are declined. The recruiter marks "declined" in the ATS and moves on.
A sophisticated recruiter extends 100 offers. 70 are accepted, 30 are declined. For each decline, the recruiter records the reason: pay, schedule, culture, accepted elsewhere, etc.
The first recruiter gets no actionable insight. They can't improve because they don't know why they're losing.
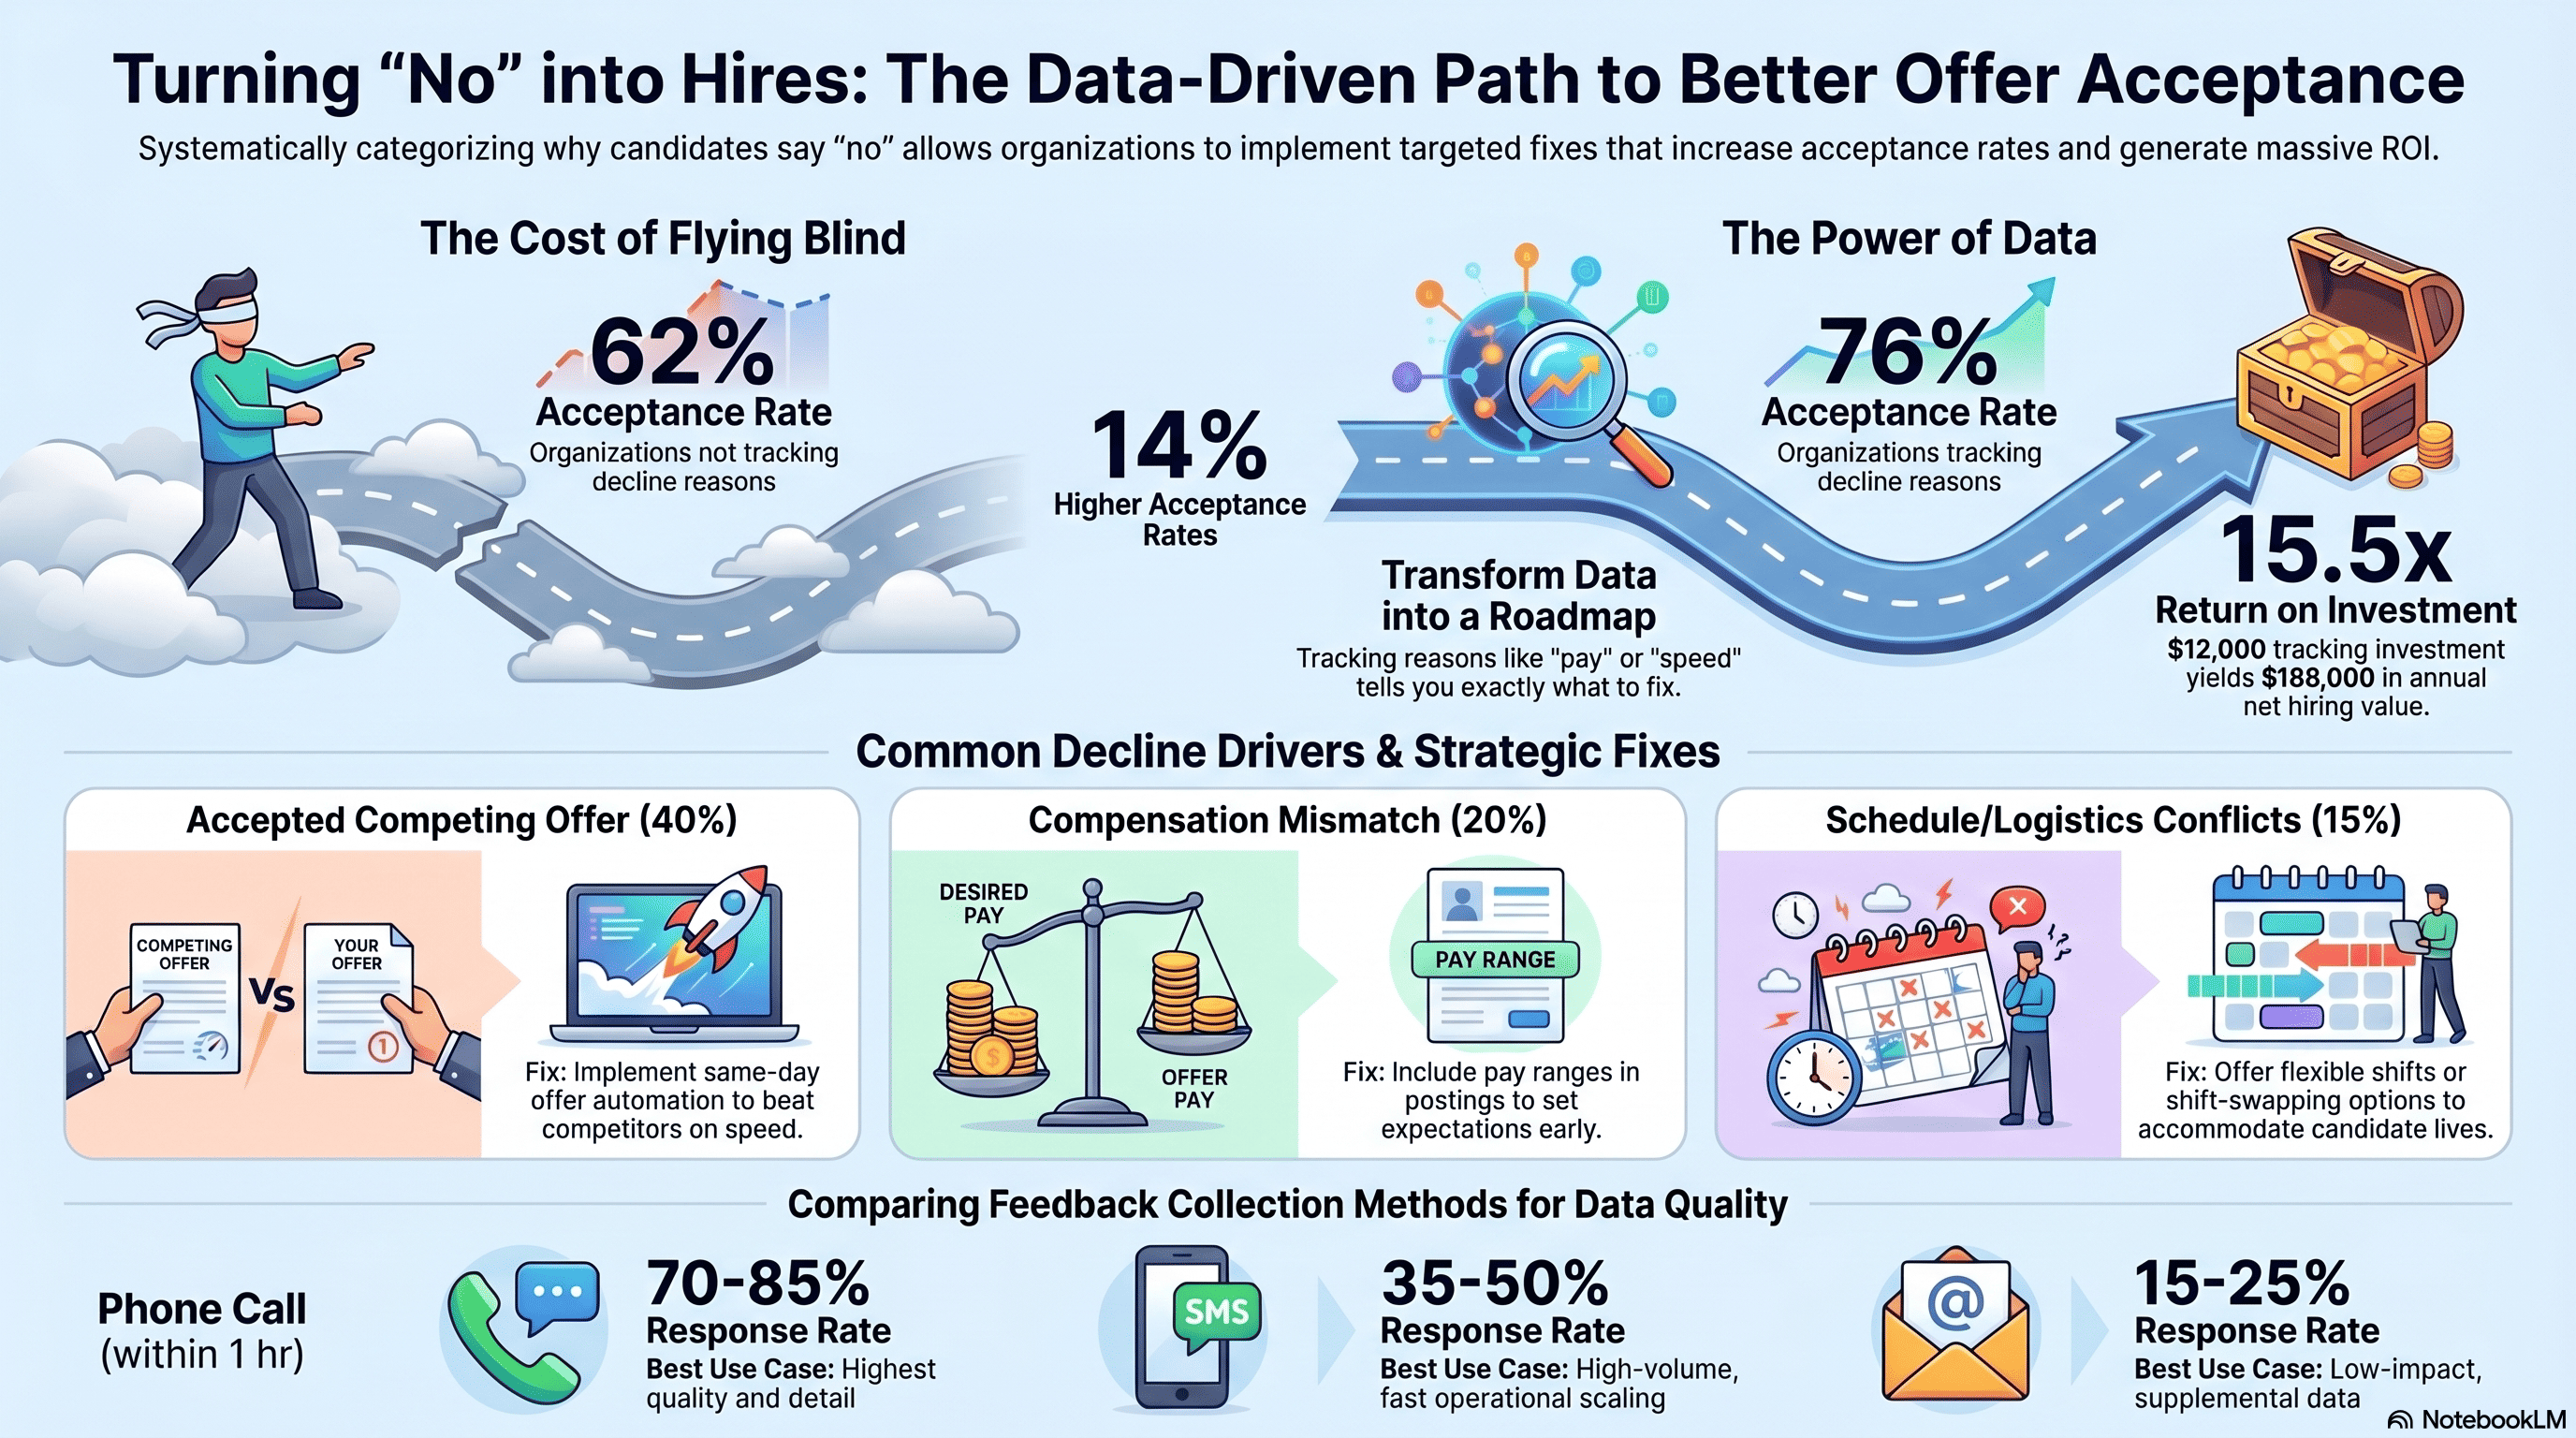
The second recruiter has a roadmap for improvement. If 40% of declines are "accepted elsewhere," the roadmap is clear: compress offer timing. If 25% are "schedule doesn't work," the roadmap is: offer more flexibility.
Data shows that recruiting teams that track decline reasons see:
- 15-25 percentage point improvements in offer acceptance rates within 6 months
- More targeted hiring strategy (better sourcing of candidates who match culture)
- Reduced hiring cycle time (fix the bottleneck, not everything)
- Better recruiter and hiring manager experience (focus on winnable candidates)
Cadient Talent surveyed 100 recruiting teams. Organizations tracking decline reasons (40 teams) had average 76% offer acceptance rate. Organizations not tracking (60 teams) had average 62% acceptance rate. 14 percentage point difference from a measurement and feedback system.
Decline Reason Categorization: Building a Classification System
Effective decline tracking requires consistent categorization. Without standardized categories, "decline reasons" are too vague to be useful.
Primary decline categories:
Category 1: Accepted competing offer (40% of declines)
Candidate received another offer and accepted it. They're no longer available.
This is not your fault (in most cases). Competing company moved faster or offered more. Insight: speed matters more than perfection.
Sub-categories:
- Accepted elsewhere immediately
- Withdrew to accept elsewhere
- Accepted elsewhere while considering our offer
Category 2: Compensation mismatch (20% of declines)
Offer pay was below candidate's expectations.
Sub-categories:
- Pay below minimum acceptable
- Competing offer paid more
- Candidate negotiated higher and we declined
Category 3: Schedule/logistics (15% of declines)
Schedule or job location doesn't fit candidate's life constraints.
Sub-categories:
- Schedule conflicts with existing commitments
- Location/commute too far
- Shift preference not available
- Start date too soon or too far out
Category 4: Role fit (12% of declines)
Candidate changed their mind about role fit after learning more details.
Sub-categories:
- Role responsibilities different than expected
- Team didn't seem supportive
- Advancement opportunities unclear
- Work environment not as described
Category 5: Culture/company concern (8% of declines)
Candidate picked up negative signals about company culture or management.
Sub-categories:
- Management style doesn't fit
- Company stability concerns
- Work environment too high-stress
- Values misalignment
Category 6: Personal reasons (5% of declines)
Candidate's personal situation changed (relocation, family needs, health, etc.)
Not actionable by recruiting. Document but don't invest in fixing.
Implementation in ATS:
When candidate declines, recruiter selects primary category + sub-category in a dropdown:
```
Decline Reason:
☐ Accepted competing offer
☐ Immediately
☐ While considering
☐ Better offer terms
☐ Compensation mismatch
☐ Pay too low
☐ Competing offer higher
☐ Negotiation breakdown
☐ Schedule/logistics
☐ Schedule conflict
☐ Too far commute
☐ Shift preference unavailable
☐ Role fit
☐ Role different than expected
☐ Team mismatch
☐ Growth unclear
☐ Culture/company
☐ Management style
☐ Stability concern
☐ Work environment
☐ Personal reasons
☐ Unknown
```
Data is collected automatically. Dashboard shows decline reason breakdown monthly.
Exit Survey Methodology: Gathering Decline Feedback
Categorization works only if you gather accurate decline reasons. That requires asking candidates why they're declining.
Effective decline survey approach:
Timing: Ask immediately when candidate declines (don't wait)
Method: Phone call is best (highest response rate, can clarify). SMS/email is acceptable but lower response rate.
Script (phone call):
"Hi [Name], thanks so much for considering the [Role] position. We understand you've decided to go in a different direction. Can I ask why? This helps us understand how we can improve our hiring process... [Listen to response]. Got it. Thanks for that feedback. We appreciate your time and interest. If your situation changes, feel free to reach out anytime."
This is conversational, not interrogative. Candidate feels heard, not grilled.
Script (SMS):
"Hi [Name], thanks for considering the [Role] offer. We understand you're declining. Quick question: what was the main reason? [A) Better offer elsewhere, B) Schedule doesn't work, C) Compensation, D) Role fit, E) Other] Feedback helps us improve!"
Multiple choice makes response easy (candidate just replies "A").
Response rate expectations:
- Phone call within 1 hour of decline: 70-85% response rate
- Phone call within 24 hours: 40-50% response rate
- SMS within 1 hour: 35-50% response rate
- Email survey: 15-25% response rate
Phone call right away is most effective. But if you have volume, SMS is faster operationally while still achieving reasonable response rates.
Compensation for feedback:
Some companies offer $10 gift card for completing exit survey. This improves response rate to 60-75%.
Aggregation:
Monthly, export all decline surveys and categorize responses:
- 40 responses, of which:
- 16 = "accepted elsewhere"
- 8 = "pay too low"
- 7 = "schedule conflict"
- 5 = "role different than expected"
- 4 = "culture concern"
Create dashboard showing breakdown.
Using Decline Data to Improve Offers and Sourcing
Decline data is only valuable if it drives action.
Action framework:
If 40%+ of declines are "accepted elsewhere":
Root cause: Slow offer timing
Actions:
- Implement pre-approved offer ranges (reduce offer time from 5 days to same-day)
- Deploy offer automation in ATS
- Create urgency in offer messaging (specific start date, "decision needed by X date")
- Conduct phone screens to understand competing offers candidates are considering
Expected impact: 15-25 point improvement in acceptance rate (people stop accepting elsewhere because your offer arrives first)
Timeline: 6-8 weeks
If 20%+ of declines are "compensation mismatch":
Root cause: Compensation below market or misaligned expectations
Actions:
- Benchmark compensation against competitors
- Adjust offer ranges (typically 5-10% increase required)
- Update job postings to include pay range (transparency sets proper expectations early)
- Train recruiters to discuss pay during phone screen (avoid salary shock at offer stage)
- Create total rewards positioning (show benefits + wage = total package)
Expected impact: 10-15 point improvement
Timeline: 2-4 weeks (ranges can change quickly)
If 15%+ of declines are "schedule conflict":
Root cause: Inflexible scheduling, poor schedule discussion during interview
Actions:
- Offer flexible scheduling (shifts available, shift swaps, ability to choose preferred times)
- Ask about schedule constraints during phone screen ("What times work best for you?")
- Match offer to candidate's preferred schedule
- Highlight flexibility in job posting
- Create a scheduling tool that shows available shifts so candidate can select preferred times
Expected impact: 8-12 point improvement
Timeline: 4-6 weeks (requires operational change, but worth it)
If 12%+ of declines are "role different than expected":
Root cause: Job description inaccuracy, interview didn't clarify real responsibilities
Actions:
- Create realistic job preview (video or description showing what day-to-day looks like)
- Have candidates shadow someone in the role for 30 minutes during interview process
- Update job descriptions to be more realistic ("You'll spend 60% on X, 30% on Y, 10% on Z")
- Train hiring managers to discuss day-to-day reality during interviews (not just selling the role)
Expected impact: 6-10 point improvement
Timeline: 4-8 weeks
If 8%+ of declines are "culture/company concern":
Root cause: Hiring manager doesn't represent culture well, or actual culture mismatch
Actions:
- Train hiring managers on representing culture positively
- Have multiple team members interview candidate (not just one person)
- Be honest about culture challenges (candidates respect transparency)
- Assess culture fit during interviews (ask questions about work environment preferences)
Expected impact: 4-8 point improvement
Timeline: 8-12 weeks (culture change is slower)
Competitive Intelligence from Decline Data
Decline data reveals which competitors you're losing to and why.
Extract from decline survey data:
When candidate says "accepted another offer," ask: "Who'd the other offer from?" (Not required, but useful info)
Track competitor wins over 3 months. Example:
- Amazon: won 6 candidates
- XPO Logistics: won 4 candidates
- Local warehouses: won 3 candidates
This tells you your competitive landscape. If Amazon is winning every candidate, you can't compete on speed (they move too fast) or compensation (they pay top-market). You need different strategy: unique perks, better culture, leadership, advancement.
Competitive offer terms:
When candidate says "better offer elsewhere," ask them to share terms: "Can you tell me what they offered? [Salary, schedule, benefits, start date, etc.] This helps us stay competitive."
Many candidates will share (not all). Aggregate this data:
- Amazon: $17/hr, immediate start, 100% health insurance, flexible schedule
- XPO: $16.50/hr, start in 2 weeks, 80% health insurance, rigid schedule
- Our company: $16/hr, start in 1 week, 80% health insurance, limited schedule flexibility
This comparison shows where you're losing competitively. If every decline to Amazon is "they offered more" and "immediate start," you know the gap.
Action based on competitive intelligence:
- If losing to Amazon: accept you won't win on speed or pay. Win on culture, management quality, advancement.
- If losing to XPO: match their speed (2-week start is achievable), match or exceed their pay ($16.50 vs. your $16), match their benefits.
- If losing to local warehouses: speed is your advantage. Move same-day. They can't match your process speed.
Competitive intelligence allows you to make strategic choices about which competitors to out-compete and which to differentiate from.
Measuring Impact: Decline Reason Tracking ROI
Implementing decline reason tracking requires investment. What's the payoff?
Investment:
- ATS configuration: 4-8 hours ($500-1,000)
- Training recruiting team: 4 hours ($500)
- Time for recruiters to collect decline reasons: 5-10 minutes per decline (built into existing workflow, minimal added time)
- Monthly analysis/dashboard: 4 hours ($500)
- Total monthly cost: $1,000-1,500
Return:
- Identify #1 decline driver within 30 days
- Implement targeted fix (varies by driver, typically 2-6 weeks)
- Measure acceptance rate improvement (typically 12-18 percentage points)
Example ROI:
Company hiring 500 people annually with 62% acceptance rate = 310 hires. They extend 500 offers.
Year 1 (before tracking): 62% acceptance, 310 hires
Year 2 (after tracking + improvement): 76% acceptance (12 point improvement), 380 hires
Additional 70 hires = $210,000 value (at $3,000 recruiting cost per hire)
Investment: $12,000 annually (monthly tracking/analysis cost)
Net ROI: $198,000 value - $12,000 cost = $186,000 net benefit
Payback period: 2 weeks (tracking + first improvement generates value immediately)
Dashboard for tracking decline impact:
Monthly declining tracking dashboard should show:
Offer Metrics:
- Offers extended: 42
- Offers accepted: 32 (76% acceptance rate)
- Offers declined: 10
Decline Breakdown:
- Accepted elsewhere: 4 (40%)
- Pay too low: 2 (20%)
- Schedule conflict: 2 (20%)
- Role fit: 1 (10%)
- Other: 1 (10%)
Trend:
- This month: 76% acceptance
- Last month: 71% acceptance
- 3 months ago: 62% acceptance
- Improvement trend: +14 points over 3 months
Action taken:
Based on "40% accepted elsewhere," implemented same-day offer automation (results: offer timing improved from 5 days to same-day, acceptance rate improved from 62% to 76%)
Next focus: "20% pay too low," considering compensation adjustment in Q3
This dashboard shows tracking is driving decisions and improving outcomes.
Scalability: Tracking Decline Data Across Large Recruiting Operations
For companies with large recruiting teams (20+ recruiters, 1,000+ hires annually), scaling decline tracking requires operational discipline.
Scaling approach:
Level 1: Decentralized collection, centralized analysis
Each recruiter collects decline reasons for their candidates. Centralized analytics team aggregates monthly.
Pro: Simple to deploy, each recruiter accountable
Con: Inconsistency in categorization, data quality depends on recruiter discipline
Implementation: ATS dropdown ensures consistent categories. Training ensures consistent interpretation.
Level 2: Automated collection
When candidate declines in ATS, system automatically sends SMS: "Quick question: why did you decline?" [Multiple choice options]
Pro: Removes recruiter burden, ensures consistency
Con: Lower response rate than personal ask, SMS only (no detail)
Implementation: ATS with automated survey feature. Response rate typically 35-50%.
Level 3: Hybrid approach
Automated SMS survey for quick categorization. Follow-up phone call by recruiter for top decline reasons (40%+ of declines in a category).
Pro: Combines efficiency (SMS automation) with depth (phone follow-up on important drivers)
Con: More complex to coordinate
Example workflow:
- Candidate declines
- System sends SMS survey, candidate responds
- System flags if response is "accepted elsewhere" or "pay too low" (top drivers)
- Recruiter calls for follow-up detail
- Detail is logged in ATS
Best practice for scaling:
Use hybrid approach. Automate collection, add targeted follow-up for strategic insight.
For 1,000+ hires annually:
- SMS survey responses: 400-500 per month (40-50% of declines)
- Follow-up calls by recruiters: 100-150 per month (25-30% of declines classified as "accepted elsewhere" or "pay too low")
- Response: 500-650 data points per month = sufficient for robust analysis
Operational cost: 20-30 hours per month (recruiters making calls) = $2,500-3,750 monthly
Value: 70-100 additional hires per year (from decline data-driven improvements) = $210,000-300,000
ROI: 56:1 to 80:1
References and Further Reading
- Cadient Talent, "Decline Reason Tracking System and ROI," 2024
- Society for Human Resource Management, "Offer Decline Analysis Study," 2023
- Harvard Business Review, "Using Data to Improve Hiring Acceptance Rates," 2023
- Journal of Applied Psychology, "Candidate Decision-Making in Offer Acceptance," 2023
- LinkedIn, "Competitive Intelligence from Hiring Feedback," 2023
- McKinsey, "Exit Data and Recruiting Process Improvement," 2023
- Talent Board, "Candidate Feedback Systems and Hiring Effectiveness," 2024
How Cadient Talent SmartSuite™ Helps
Cadient Talent’s SmartSuite™ platform automates compliance workflows, embeds regulatory guardrails directly into your hiring process, and maintains audit-ready documentation at every stage—so your team can focus on finding great talent while staying protected from costly violations.